Google Data Studio Facebook Ads E-Commerce Template
DataBloo created a Google Data Studio template that leverages session, conversion, and Facebook Ad cost data blended in Google Analytics. You can use this report to measure the performance of Facebook campaigns. In addition, you get a unified reporting dashboard that can be shared with internal teams and clients.
This Facebook Ads E-commerce template not only provides session and e-commerce conversion metrics, it also allows you to measure cost per conversion, conversion rates, and ROAS on the site source and placement breakdown; valuable breakdown insights we lost in the Facebook Ads Manager with the iOS14 Privacy update.
In this post, we will go over some general nuances related to tracking Facebook Ads in Google Analytics as well as dive into the details of how this Google Data Studio template sets itself apart. If you want to jump right to the template you can grab it here.
Measuring Performance in the Facebook Ads Manager is Limited
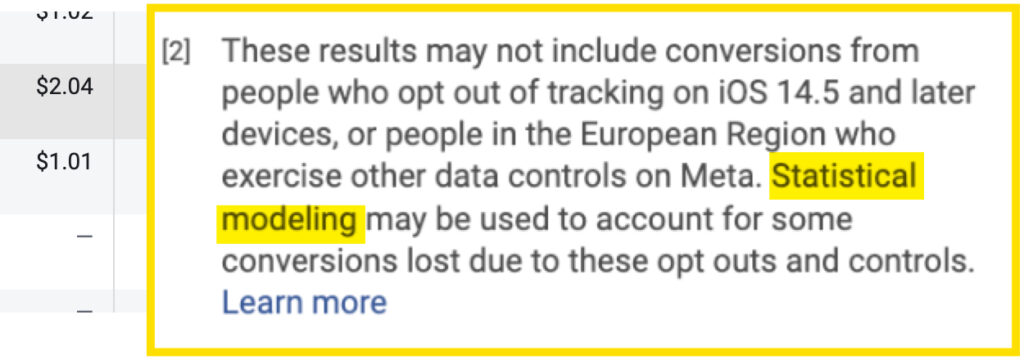
Since the iOS14 Privacy update, Facebook switched to an aggregated event measurement model and removed breakdown performance data; specifically site source and placement breakdowns. In addition, conversions are attributed using statistical modeling therefore they are not always accurately attributed in the Facebook Ads Manager. As a result, it is hard to understand what campaigns, ad sets, ads or placements are actually working. To make up for the inaccuracy and data loss in the Facebook Ads Manager, marketers are relying on Google Analytics for Facebook Ad performance reporting.
The Drawbacks of Measuring Facebook Ads in Google Analytics
The biggest drawback with Google Analytics is that you cannot see cost data associated with campaigns, ad sets, ads, or placement breakdowns. So although you can measure Facebook Ads sessions and conversion rates, you don’t get a read on campaign efficiency. Since conversion rates on their own are not indicative of efficiency it is important to measure CPA and ROAS as well.
Google Analytics provides a wealth of data that is valuable for analysis. However, it is not very good at creating clean reporting dashboards that you can share with your team or present to your clients. This is where the value of a Google Data Studio comes into play. First, let’s take a look at how we can automatically bring Facebook Ads cost data into Google Analytics.
Bridging the Gap Between Facebook Ads and Google Analytics
To bridge the Facebook Ads and Google Analytics gap you need to link Facebook Ads and Google Analytics. By doing this, cost and session data are automatically blended in Google Analytics. With cost data imported, you can start to measure key metrics such as CPA and ROAS in addition to sessions and conversion rates.
To import cost data and blend session and conversion data we use EasyAutoTagging. With EasyAutoTagging you can automate cost data imports and auto blend cost and session data on the campaign, ad set, and ad level. If you want to take this a step further, leverage Dynamic UTM Profiles and measure efficiency on the placement breakdown.
With all of your cost data housed in Google Analytics, you can measure conversion rates, cost per conversion, and ROAS. Additionally, you can view conversion rates and efficiency metrics on the site source and placement values listed below:
utm_source = {{site_soure_name}}
- fb
- ig
- an
- msg
utm_ medium = {{placement}}
- Facebook_Desktop_FeedFacebook_Mobile_Feed
- Facebook_Stories
- Facebook_Instant_Articles
- Facebook_Instream_Video
- Facebook_Marketplace
- Facebook_Right_Column
- Instagram_Feed
- Instagram_Stories
- Instagram_Reels
- Instagram_Explore
- Messenger_Inbox
- Messenger_Stories
- an
Bringing It All Together with Google Data Studio
With all of your data housed in Google Analytics, we can now create a clean and readable DataStudio Facebook Ads E-commerce template. To do this we partnered up with Giannis at DataBloo. (Giannis is the mastermind behind creating Data Studio Templates to streamline the reporting workflow for over 700 marketers and agencies.)
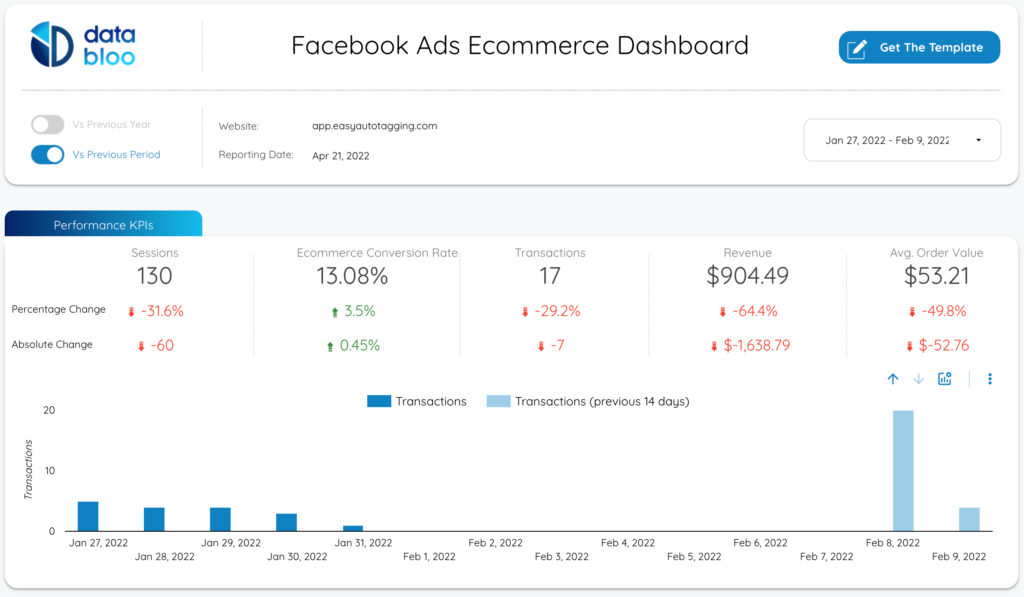
The Google Data Studio report is broken down into 6 sections:
- Performance KPIs
- Cost Overview
- Source Breakdowns [Facebook, Instagram, Audience Network]
- Medium Breakdowns [Placements i.e. Facebook_Mobile_Feed, Instagram_Feed…]
- Performance by Product
- Performance by Country
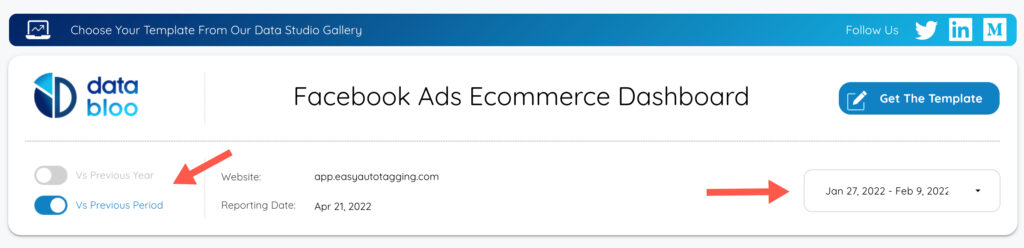
In the report header, you can easily change the date range and your comparison windows to the previous period or compare year-over-year trends.
Next, we are going to focus on the two sections that give us site source and placement breakdown data.
Source and Medium Performance Sections
The source and medium sections of this E-commerce report are where we can get data that is no longer accessible in the Facebook Ads manager.
First, the source section provides sites source breakdowns. The pie chart on the left represents the breakout of sites your ads get served on. In this example, you can see that most traffic is indexing on Facebook. On the right, you have a table breakdown with one row for each site source your ads were served on. This table view includes sessions, transactions, and cost per transaction.

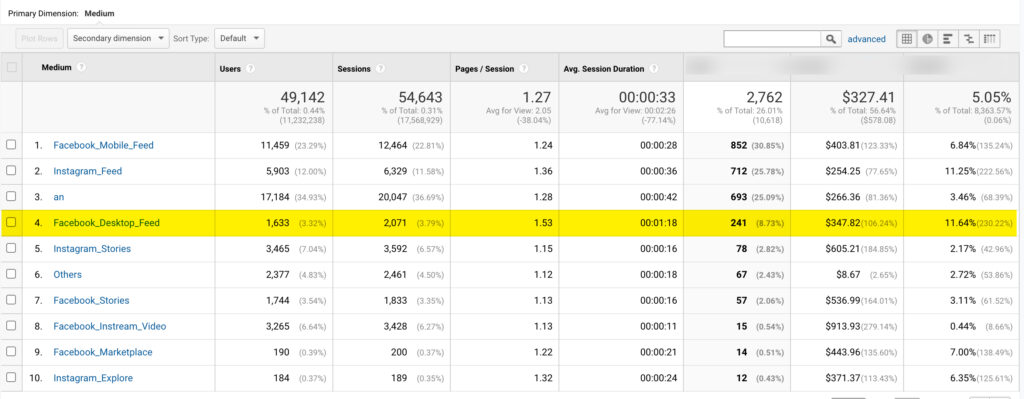
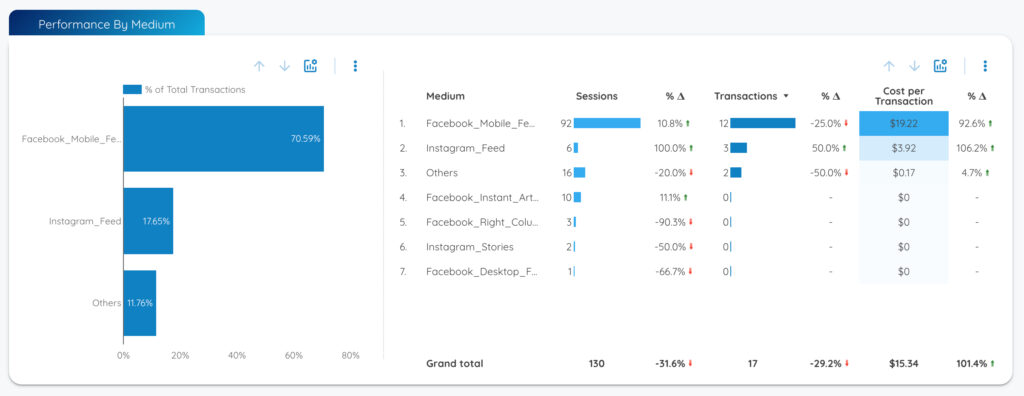
Second, let’s explore the medium section which provides a detailed view of performance by placement. As you can see, the bar chart on the left highlights the highest volume placement as Facebook_Mobile_Feed followed by Instagram_Feed. In addition, similar to the source report, you can get a table breakdown by the placement that includes sessions, transactions, and cost per transaction.
Conclusion
Google Data Studio is a powerful reporting solution to simplify reporting dashboards and create unified reporting views for internal teams and clients. By joining Facebook Ads cost and Google Analytics session data you have the ability to leverage GA for granular analytics and optimization exercises and monitor and share reporting with a streamlined Google Data Studio dashboard.
You can find this Google Data Studio Facebook Ads E-commerce template on the DataBloo site here.
Leave a comment