Marketing Dashboard – Google Data Studio [Free Ecommerce Template]
How much time do you spend updating your Marketing Dashboard every week? What if I told you that you can reduce the time it takes to update your weekly or monthly report template by more than 50% for free using Google data studio?
Reporting can make or break you as a digital marketer. According to Avinash Kaushik, the time should be split 80% analysis and 20% reporting. This makes perfect sense since the analysis is where we find actionable data that you can then apply to make business improvements, not the reporting itself. Unfortunately, more often than not this is not the case.
Before I get started, I want to differentiate between the client and the internal facing Marketing Dashboard.
Client Facing Marketing Dashboard
Client facing reporting should highlight what digital initiatives are driving real business results, not call out every single nuance and tweak that you are making to optimize campaigns. The narrative of data driving business results should be simple, straightforward and to the point but still, data-driven.
Internal Facing Dashboards
Internal reporting can be less pretty and more nitty-gritty. The purpose of these reports is for the marketer to perform in-depth analysis and quickly identify optimization points. Some of this can also occur directly within the reporting or ad platform as there are so many interconnected data points within a reporting platform such as Google Analytics, Google Ads or Facebook Analytics.
Can life get easier?
Generating Marketing Dashboards efficiently is possible without spending your life manually slicing and dicing data into a weekly or monthly report as long as tracking is properly in place. (I will expand on this a little further down.)
Today I am going to focus on building a client facing marketing report template, giving you guys a reporting process and Google data studio Marketing Dashboard template you can apply to ecommerce campaign for weekly or monthly cross channel Facebook and Google Ads reporting.
Marketing Dashboards
Before we get started, let’s cover some common Marketing Dashboards specifically looking at awareness, consideration and direct response; further down in this post the focus will be on Ecommerce direct response campaigns.
Awareness/Attention Digital Marketing Report
What is the objective: When running ads to build brand awareness, our goal is to create exposure and reach as many [relevant] users as possible with our creative. To create a meaningful interaction at this stage means we want to run visually and engaging creative that users consume.
How do we measure results: This means that people will not necessarily go to your website to learn more about you in this step so we need to measure results accordingly and look at metrics such as reach, cost per reach, video view length, engagements, and creative performance.
Consideration Digital Marketing Report
What is the objective: In the consideration phase, we can send users to our website but the expectation is to give them more information or ask them to submit their email (lead) not make a hard sell.
How do we measure results: First we need to have clearly defined goals. Next, ensure accurate tracking of key actions that align with these goals to measure the success.
Direct Response Digital Marketing Report
What is the objective: Direct response in an Ecommerce environment directly relates to sales. It also encompasses lead generation or product sign-ups.
How do we measure results: The success of a direct response campaign is measured in sales and ROAS.
Ecommerce Google data studio Marketing Dashboard
So what do we want to convey to the client in a Google data studio weekly or monthly report template?
To build a Marketing Dashboard that accurately communicates results, we need to break down performance into five specific cross-channel performance components:
Performance Overview
Product Performance
Campaign & Ad Performance
Landing Page Performance
Demographic Performance
Let’s dive right in and create a Marketing Dashboard for each one of these pieces. Before we start, we need to cover some tracking nuances for Google Ads & Facebook to make sure all of our cost and session data is properly aggregated in Google Analytics. This way, we can skip the additional step of data blending in Google Data Studio.
Note: In another post, I will cover creating weekly or monthly reporting templates covering each channel, Google Ads and Facebook, to identify keywords, placement, creative and targeting respective to each channel so keep a lookout for these.
Google Ads Account Linking and Enabling Auto-tagging
Make sure that you have auto-tagging enabled and are linking your Google Ads and Google Analytics accounts.
Note: You can now enable auto-tagging when linking your Google Analytics account. If for some reason you have this turned off for a specific Google Ads account, you can also change the settings within the specific account.
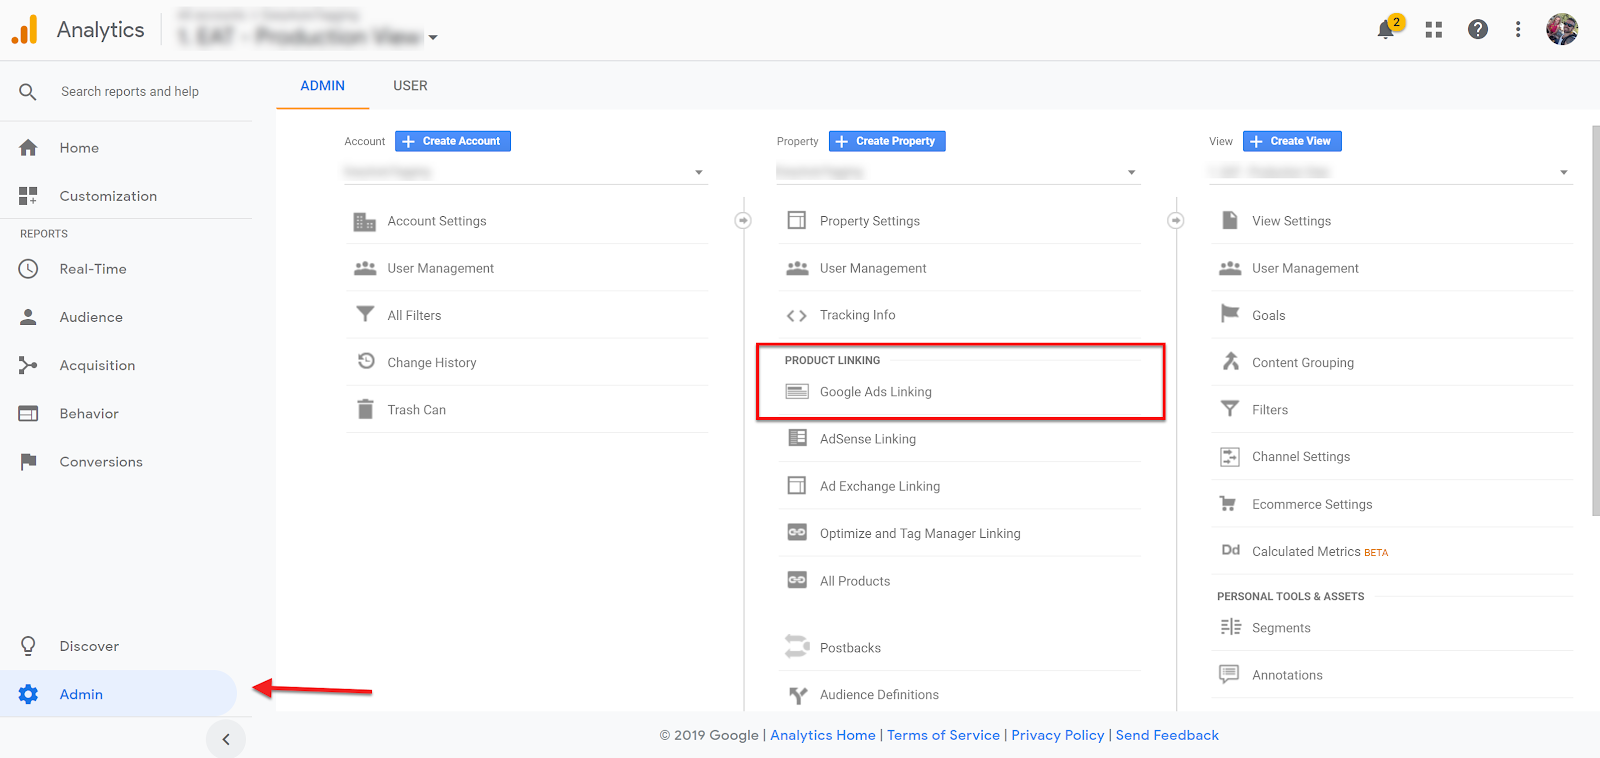
To link your Google Ads and Google Analytics Account go the Google Analytics admin section.
Under the Property column click on Google Ads Linking below Product Linking
Now select your Google Ads account to link
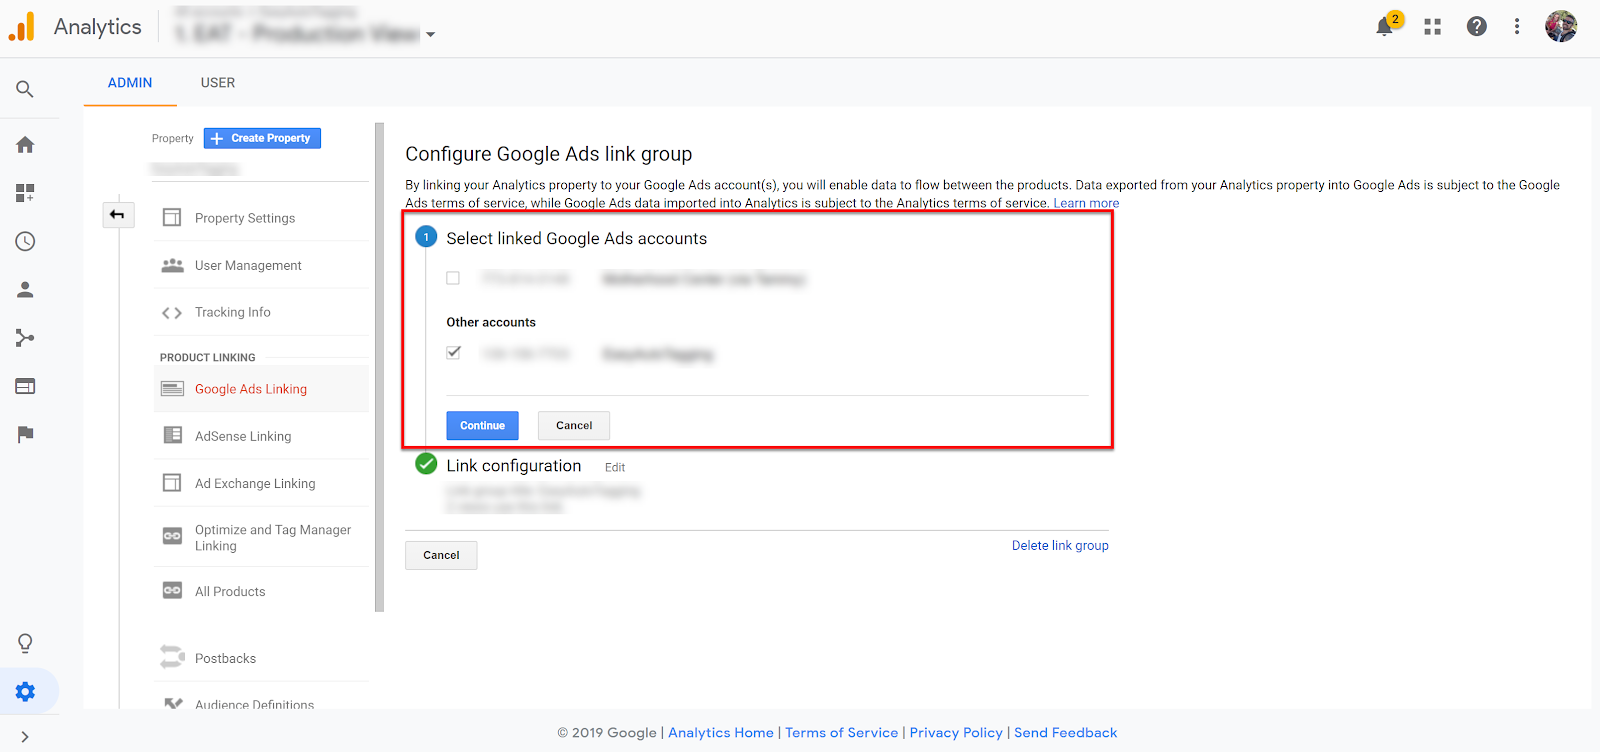
Next, give the Link Group a title and select all the views that apply

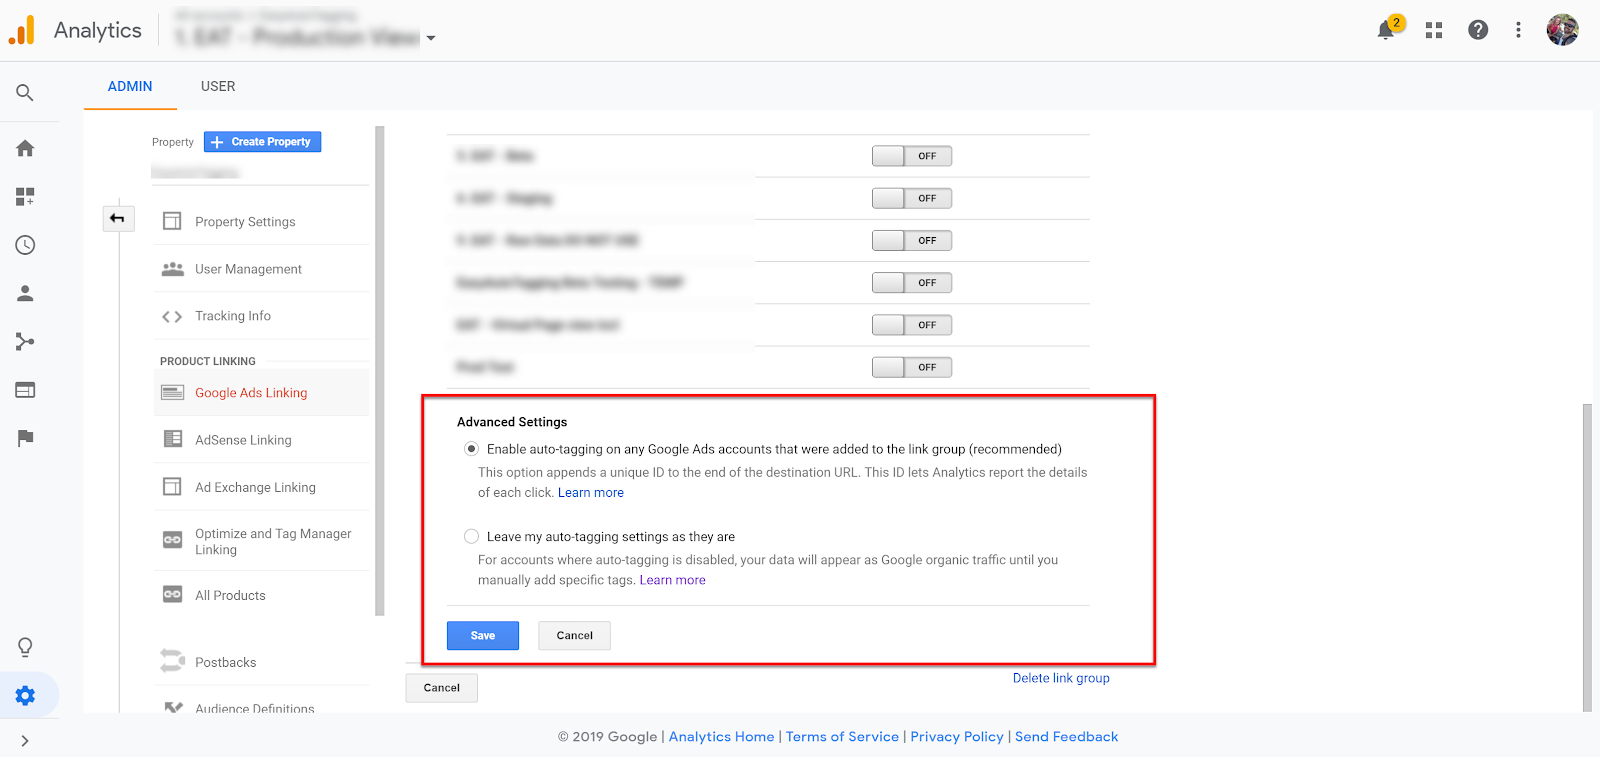
Make sure to enable auto-tagging in the advanced settings and click save.
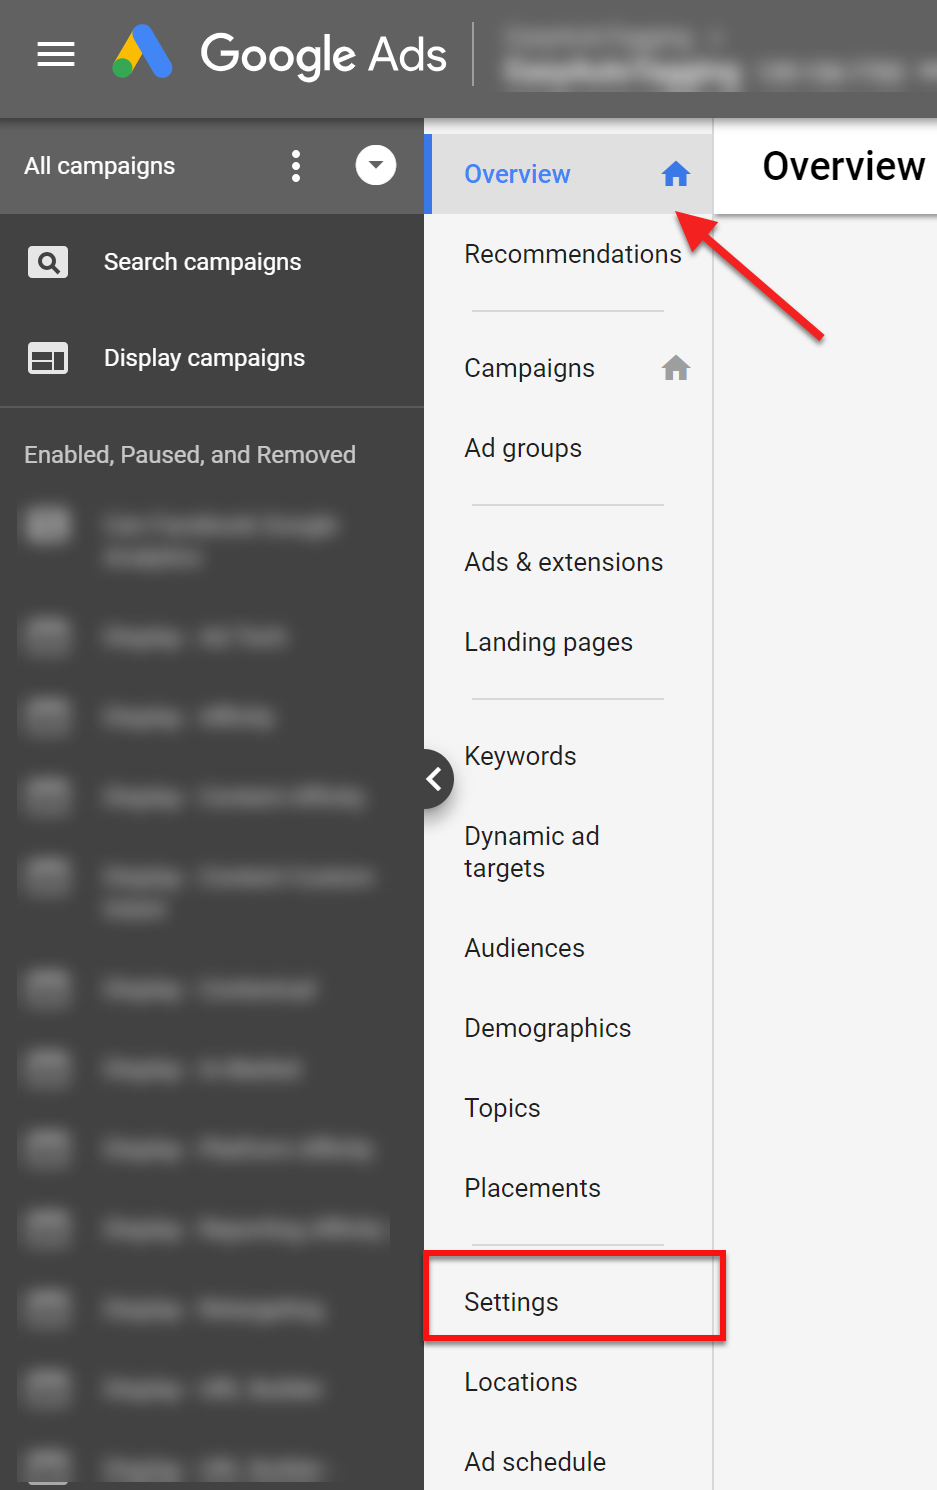
If your auto-tagging is disabled, you can also activate this in your Google Ads account.
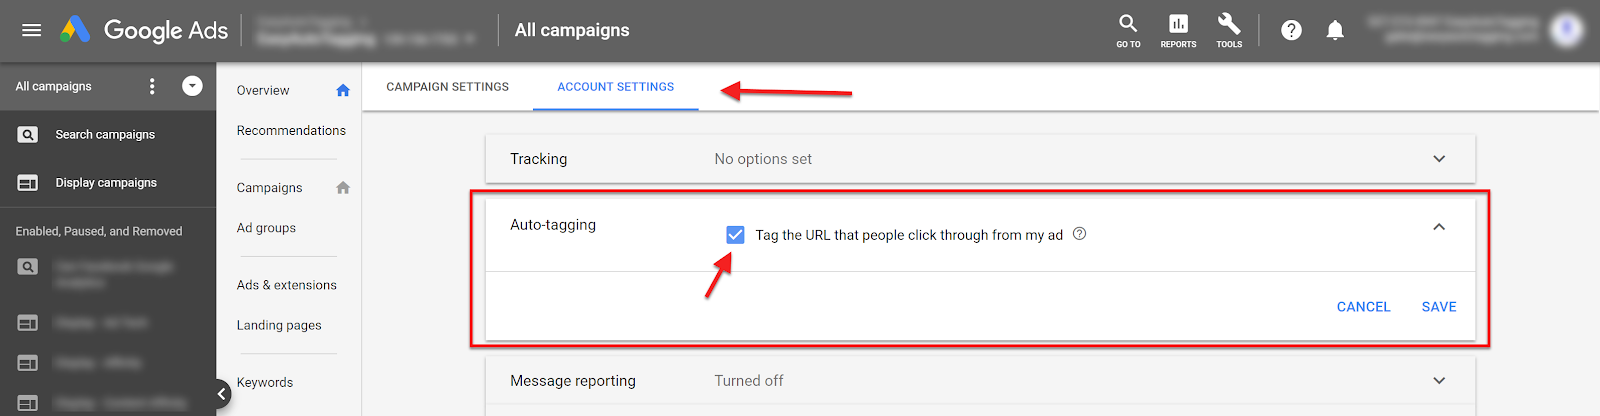
In your Google Ads account while active on the overview tab click on Settings
Then go to the Account Settings tab, expand Auto-tagging and select the checkbox to Tag the URL that people click through from my ad
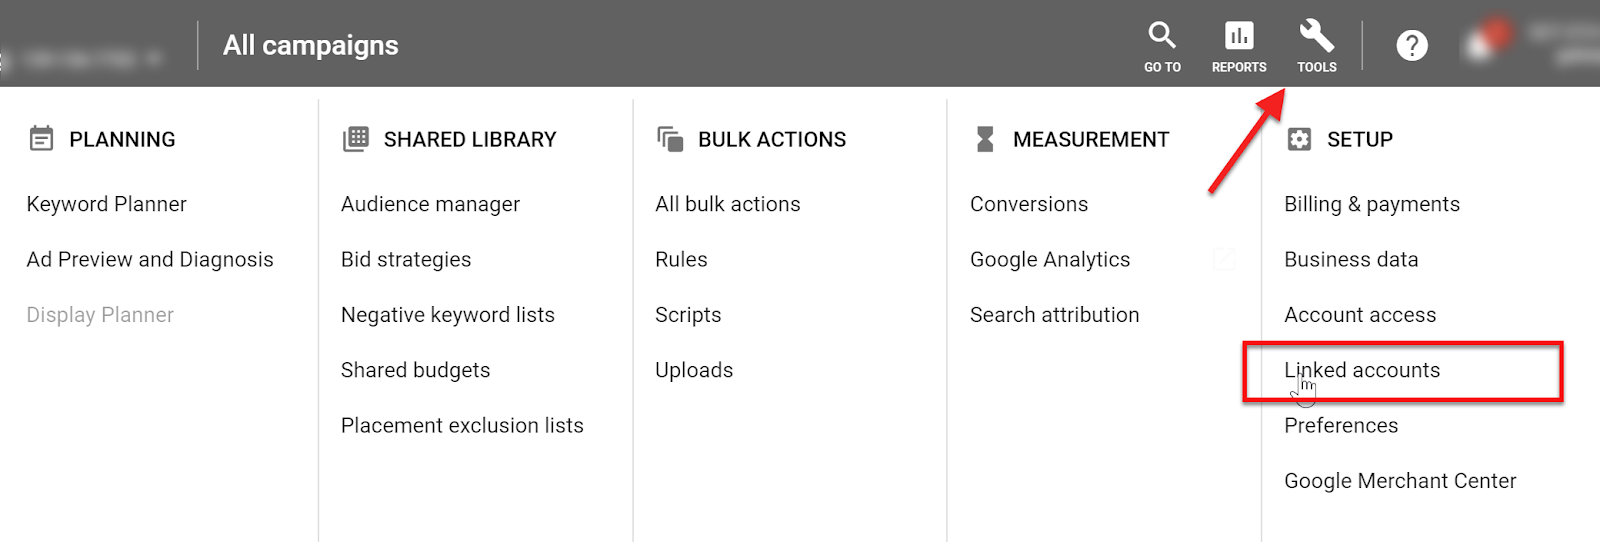
To make sure your account is properly connected, go to Tools then click on Linked Accounts under Setup
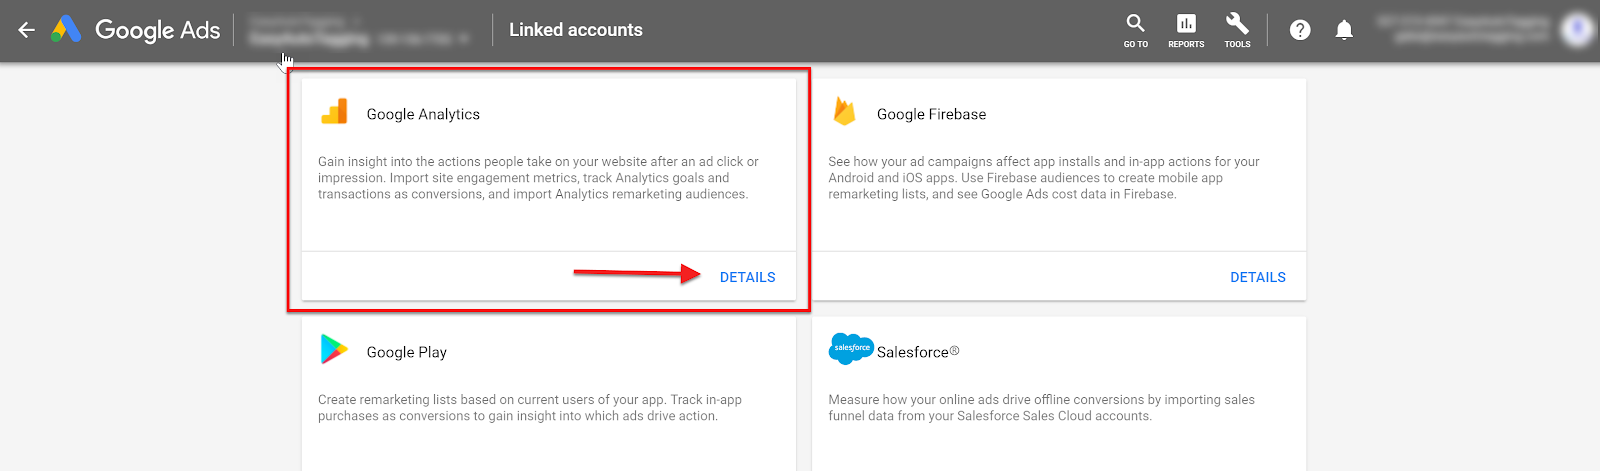
Next click Details on the Google Analytics card
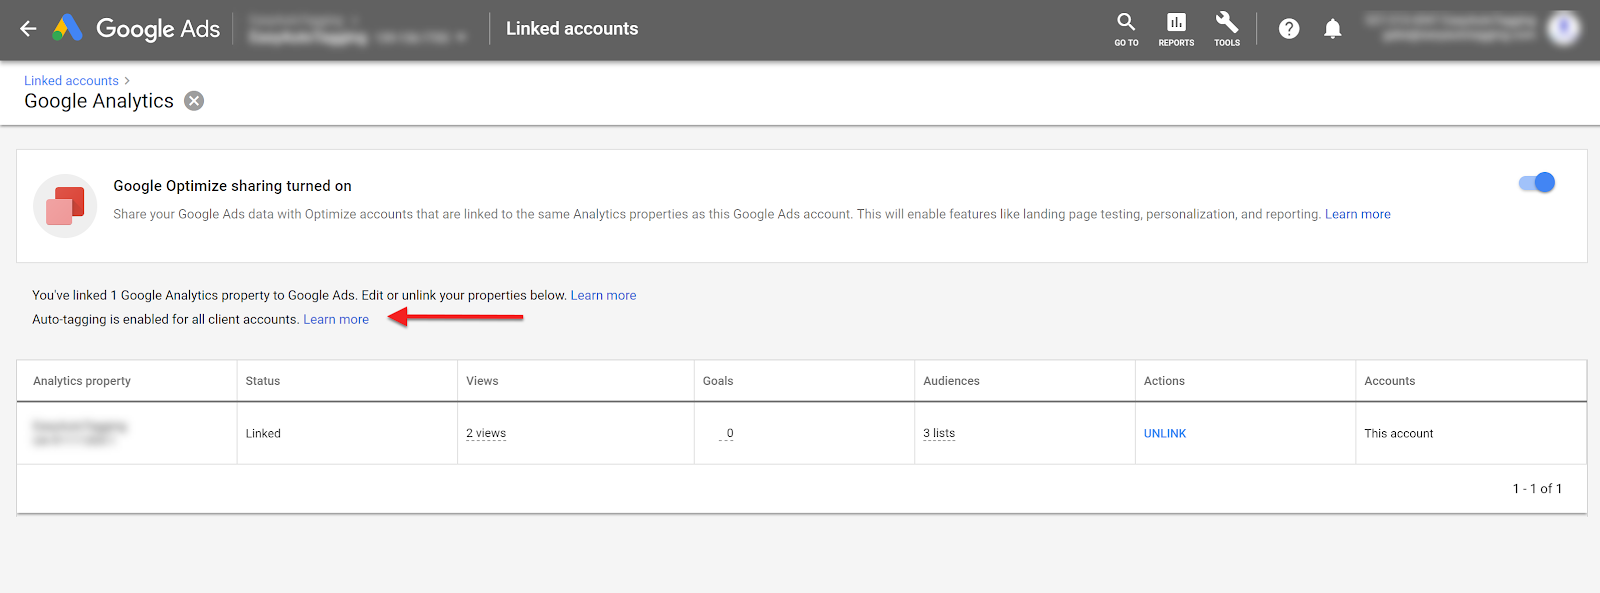
You can see what Google Analytics property and what views are connected to your Google Ads account.
You can also see a note that lets you know Auto-tagging is enabled for this account.
Facebook Ads Manager Account Linking and Auto-tagging
To pull Facebook data into Google Analytics for your Marketing Dashboard, you have three choices
- Make sure all your Facebook ads have UTMs appended, then manually import cost data into Google Analytics via bulk export/import on an ongoing basis.
- Use a third party connector and blend your Google Analytics and Facebook data in Data Studio using the blending feature.
- Use EasyAutoTagging to tag all of your ads and automatically import and blend Facebook and Session data in Google Analytics. This essentially functions the same as Google Ads by linking Google Analytics and Auto-tagging all of your ads.
Let’s go with the third and easiest approach and use EasyAutoTagging to append custom UTMs to all of your links and link Facebook Ads account to Google Analytics.
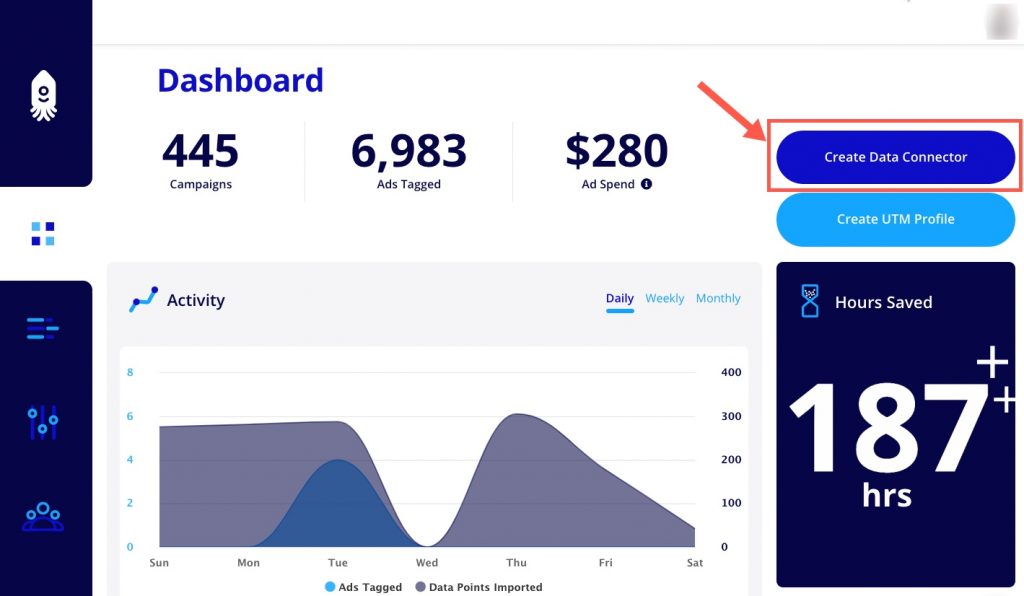
Create an account (or login to an existing account) and click Create Data Connector in the top right corner of your dashboard. Then, complete the onboarding steps.
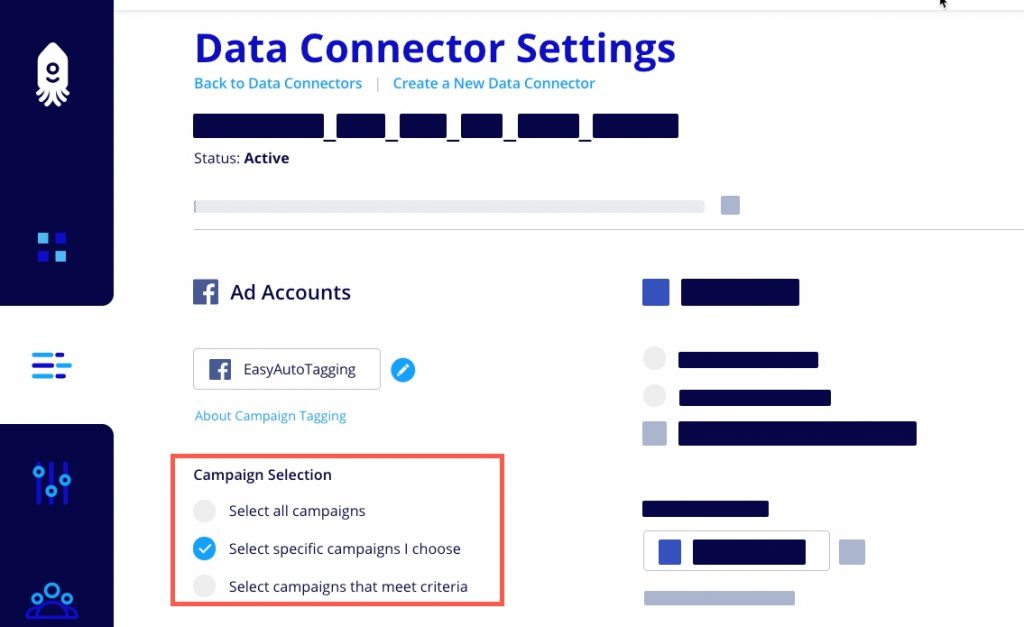
Next, under Campaign Tagging select static or dynamic rules to define what campaigns will be included for tagging and cost data imports.
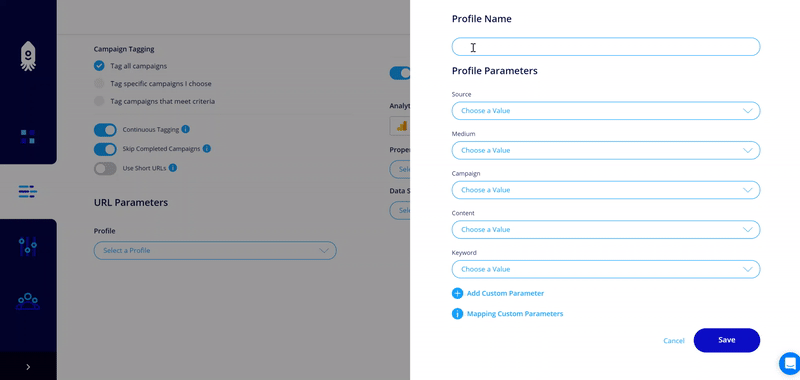
Now create your UTM Profile. Your UTM Profile will be used for both tagging and cost data import definitions.
Next, connect your Google Analytics account and select a Cost Data Set.
Note:
- Learn how to create a cost data set here.
- Learn how automatic data blending for cost, impression, click and session data works here.
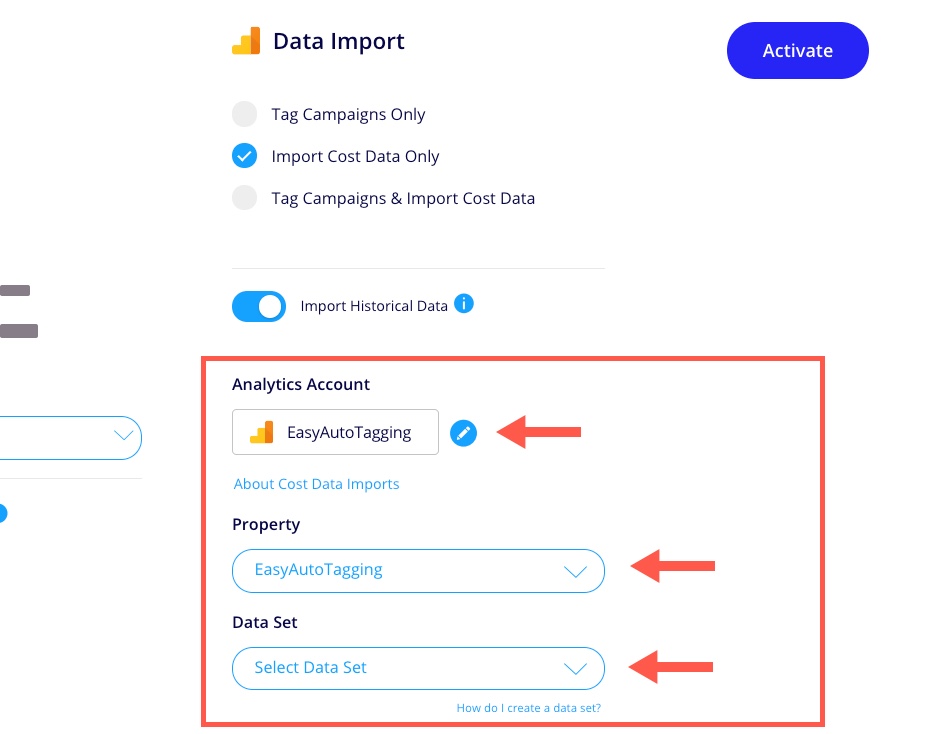
Now that your Data Connector has been configured click Activate. Once the processing job has completed you will receive a Data Connector Email Update.
Your cost data will continue to import daily.
Enhanced Ecommerce Settings
This report requires that Google Analytics Enhanced Ecommerce is active and properly implemented on your site.
If you need help setting up Enhanced Ecommerce, you can reference this comprehensive post by Aaron Agius on Neil Patel’s site which provides A Step-by-Step Guide to Using Google Analytics’ Enhanced Ecommerce Features.
Let’s get started
Now that we have the proper tracking in place, the first thing you want to do is go ahead and grab the Google data studio Marketing Dashboard template here
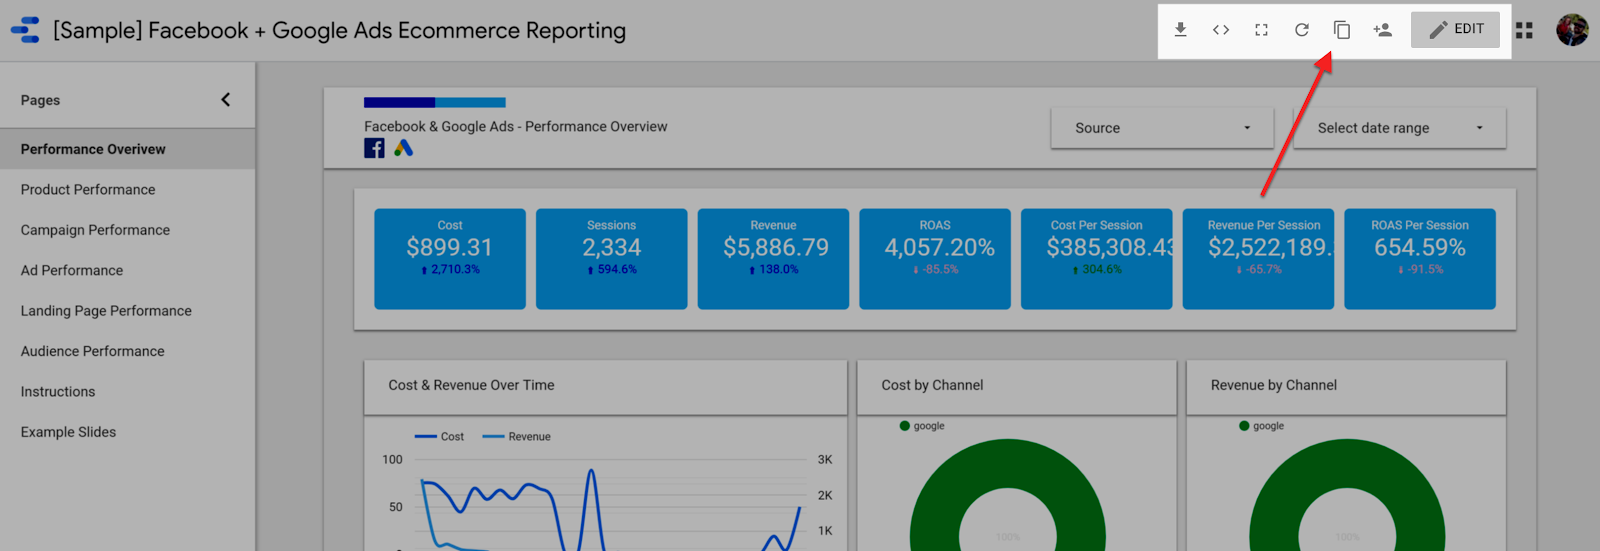
Once you have the template open, go to the top right and click Make a copy of this report
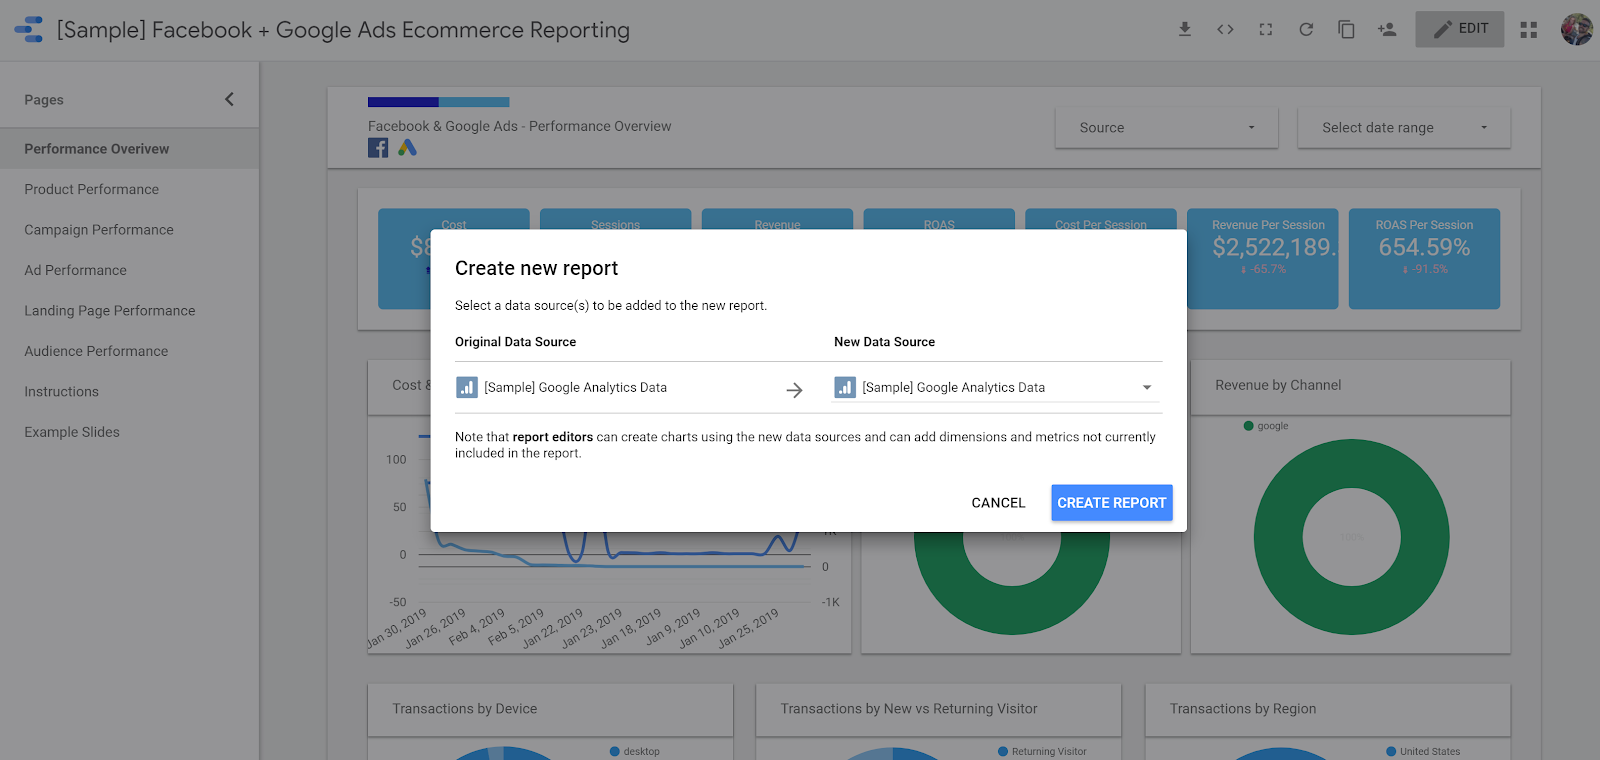
First, we need to connect our data source, in this case, Google Analytics. In the popup or modal dialogue, add a new data source
Next, let’s make sure the predefined filters match your tagged ads source/medium values. To do this, update the report wide source/medium filter to include/exclude data sources to display in this report. You can access this filter from any chart in the report.
Note: In this case, all data is filtered down to Facebook and Google Ads. You can open up or restrict this filter further based on your needs. Whatever sources you filter down to will apply to the dynamic drop down filter control at the top of each report page.
Delete the Instructions and Examples Slides pages and you should be ready to use the report.
Let’s go over each slide in detail.
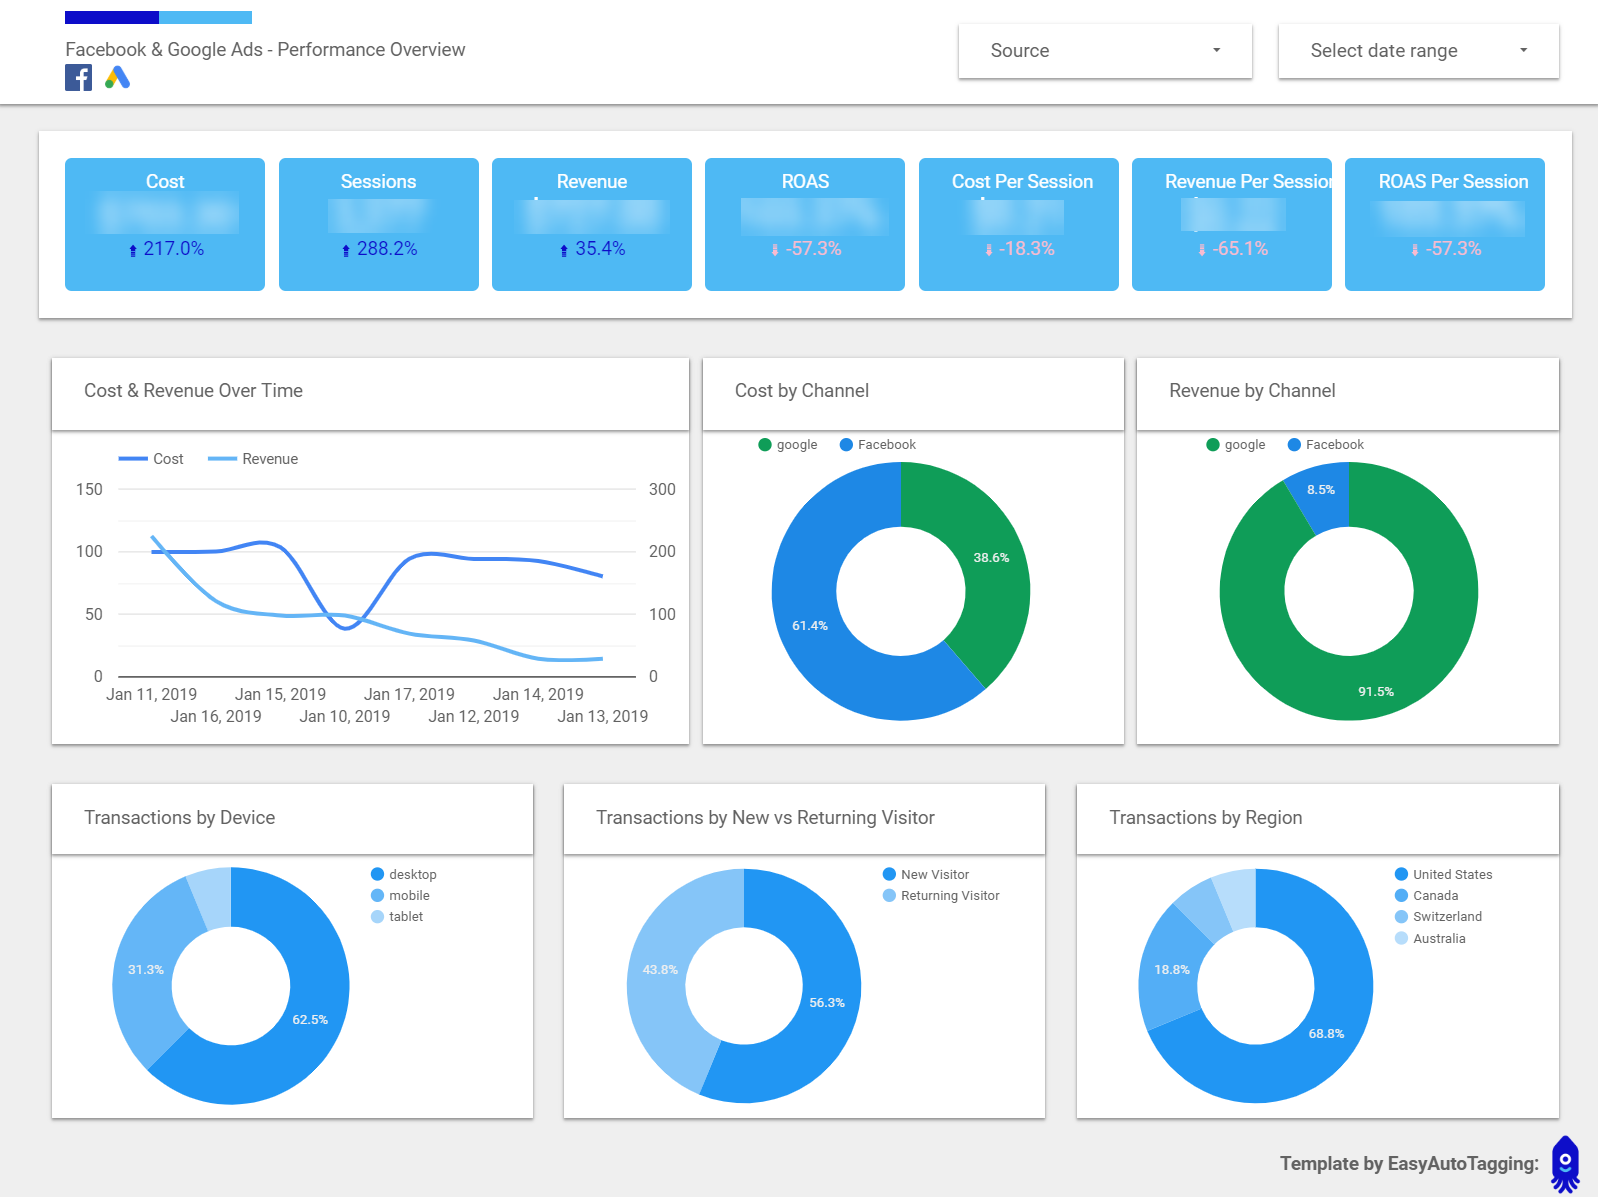
Performance Overview
On this slide, we want a quick performance overview that displays cost and revenue as well as the cost and value of each session.
On the bottom, the pie charts provide an overview of transactions generated by device, new vs returning visitors, and by region.
All dates are set to rolling dates (last 30 days) but you can also customize the date range using the dynamic dropdown filter.
The Source drop-down lets you segment the data by source i.e. Google Ads or Facebook.
Note: A paid session is a paid link click that Google Analytics was able to successfully translate into a session. Given the many variables that could strip the tracking tag off of a link, I only want to look at clicks that turned into successful sessions; these are real people that can convert.
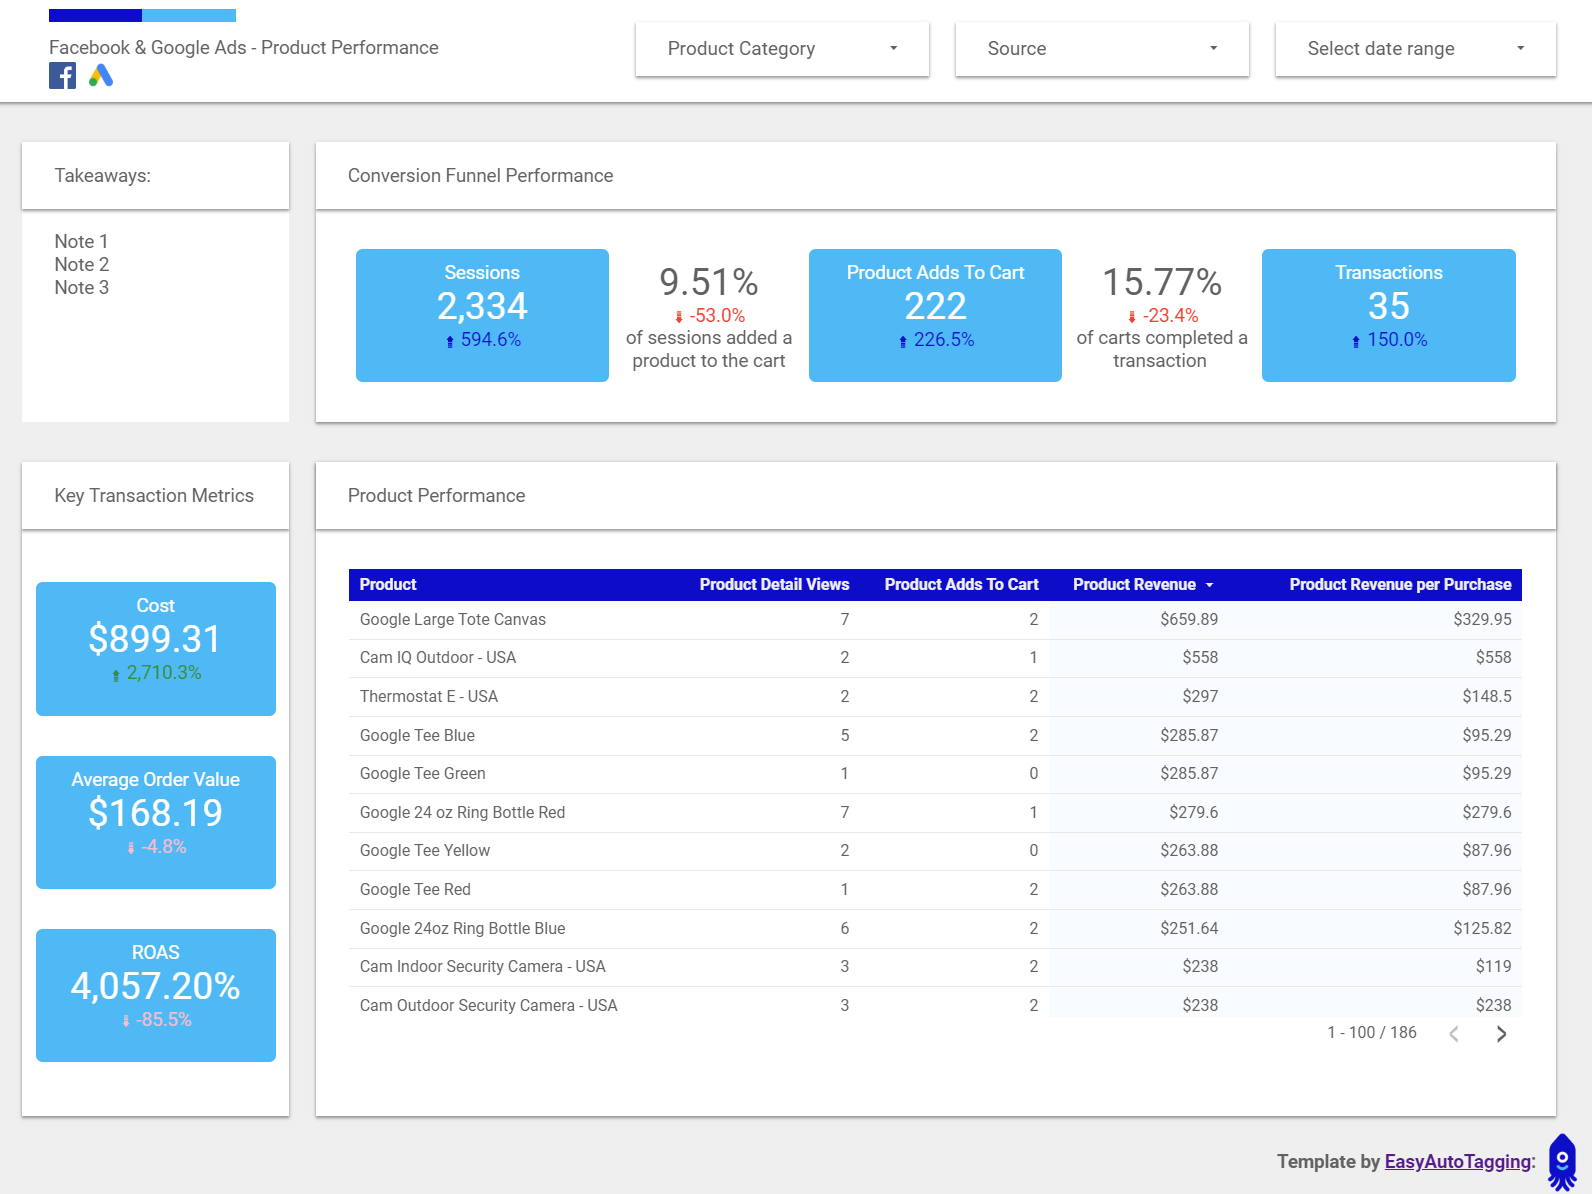
Product Performance
The product performance slide allows me to analyze the value of each product sold. In the header, you can filter down to a product category to see which category is performing best. You can also filter down to the source if you want to analyze performance by Facebook or Google Ads specifically.
Referencing scorecards you can analyze product funnel effectiveness, see a list of top performing products and get a look at key metrics such as cost, Avg. Order Value and ROAS compared to the previous period.
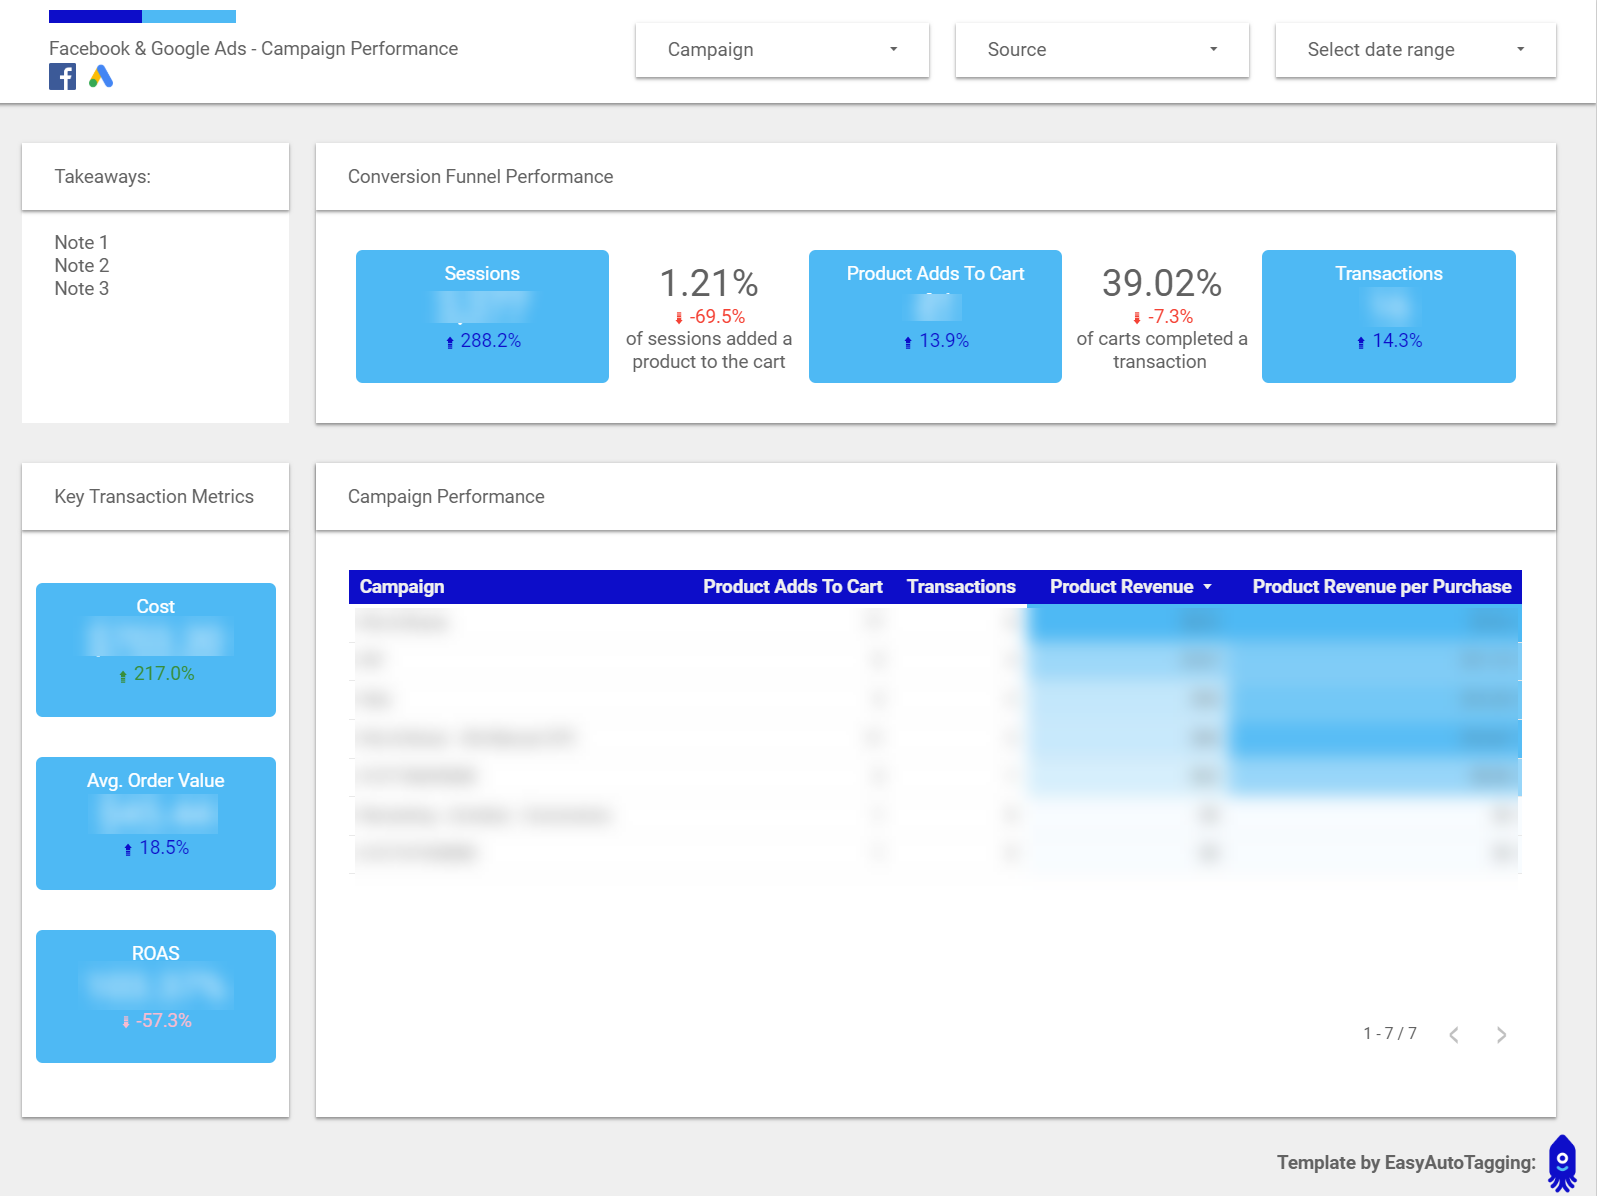
Campaign and Ad Performance Slides
Campaign and Ad performance have a similar breakdown as product performance. However, the filters, tables and scorecards are looking at campaigns and ads so you can gain a better understanding of their performance.
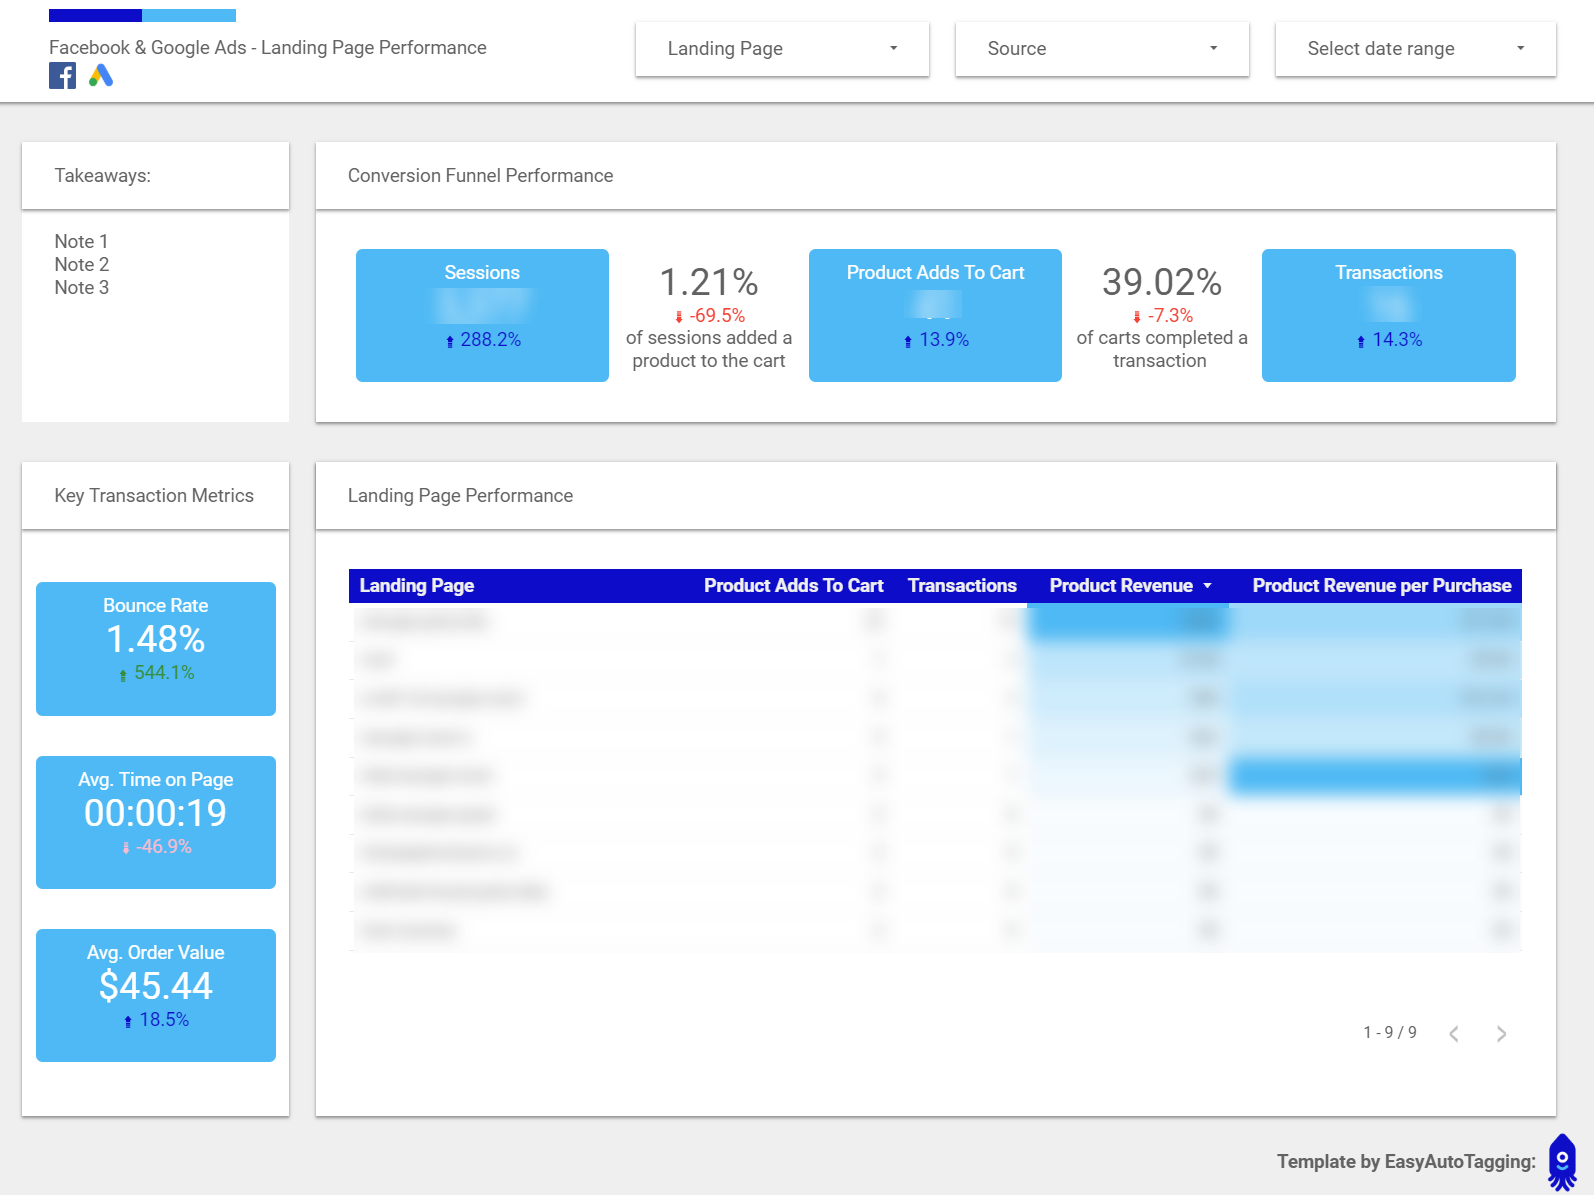
Landing Page Performance
The landing page performance page has the same layout as campaign and ads, but it highlights additional values such as bounce rate and average time on page.
You can filter down to a subset or specific landing page to analyze performance. You can also filter down to source and quickly display what channel is most effective with a specified landing page.
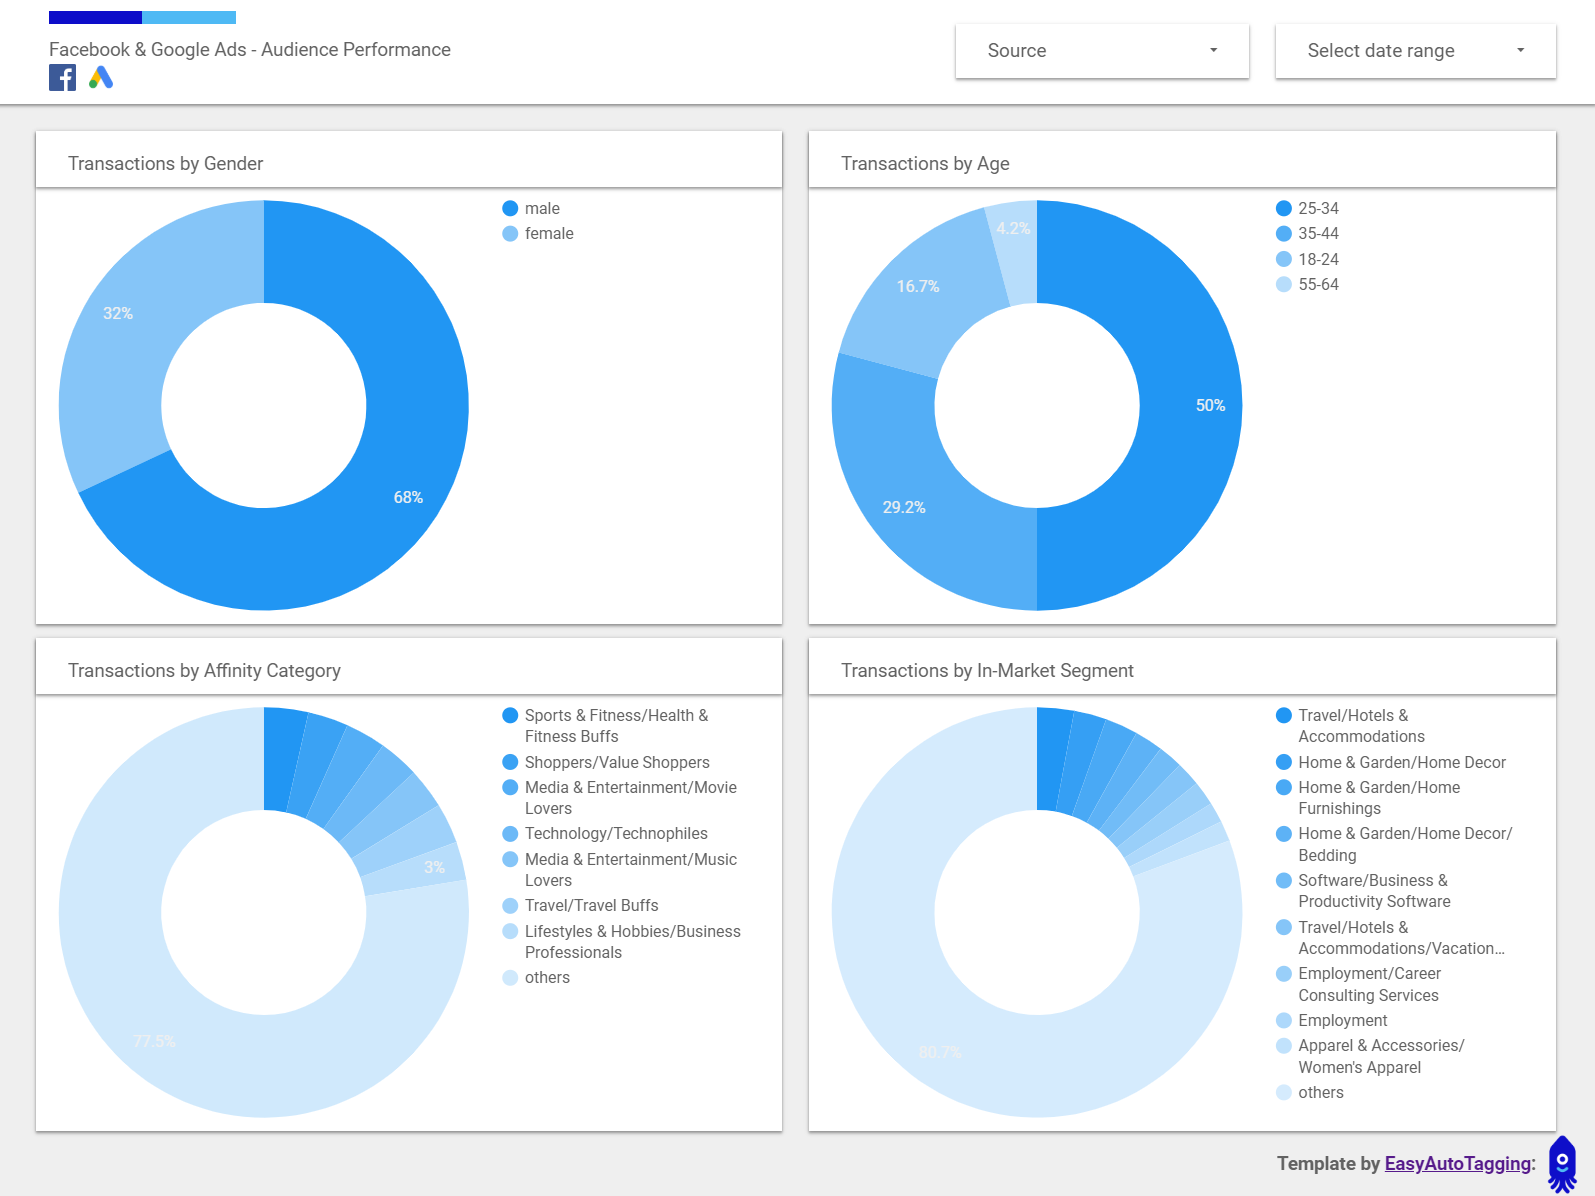
Demographic Performance
This pulls four pie charts into your Marketing Dashboard to identify what gender, age affinity and in-market segment are producing the most transactions.
You can use these insights to hone in on the best performing demographics and adjust targeting to improve results.
Note: In this case, I am only pulling in Google Analytics data. If you are pulling Ad Set Names [read: Audience Names] into a predefined UTM field such as utm_term or are leveraging custom parameters, you can also generate Facebook audience performance charts. To pull custom parameters into Google Analytics, you need to pass these to a custom dimension in Google Analytics. This can easily be done using the Google Tag Manager; you can check out Mapping Custom Parameters to Custom Dimensions on how to achieve this.
Conclusion
Properly setting up your Google data studio Marketing Dashboard from the start can save you time and headaches. Instead, you can place your focus on analysis to identify actionable data.
I don’t know if we will ever enter an era where reporting will be simplified to the point of complete automation, but in the meantime, with the proper tech stack, we can get pretty close.
If you found this report template useful, please share it 🙂
Let me know of any thoughts in the comments.
Useful article! This dashboard is hitting multiple birds with one stone.
I also like the “Can life get easier?” bit. I can totally relate.
Google Data Studio can also do SEO dashboards.
Here’s a simple step by step guide. https://www.lupagedigital.com/blog/seo-dashboard-google-data-studio/
Really helpful article. We have created similar dashboards for Google and Facebook Ads and Facebook that can be used to monitor the overall performance of paid activities.
https://databloo.com/product/essential-google-ads-template/
https://databloo.com/product/facebook-ads-data-studio-template/
We really appreciate if you could share your feedback with us! Thank you 🙏
Thanks for sharing these look great!