Custom Groups In Looker Studio: Simplifying Data Segmentation
Written by: Gabe Solberg Read time 3 minutes
In this post, I’ll show you how to create Custom Groups in Google Looker Studio, a powerful way to tailor your data reports to your needs. While you can also use Google Sheets formulas to achieve a similar outcome, using Looker Studio’s Custom Group feature offers a more direct approach.
I’ll explain both methods, highlighting how each can help you achieve your reporting goals.
Important Tip: Ensure you’re creating custom groups at the report level, not at the page or chart level.
Why Use Custom Groups In Looker Studio
Think of custom groups as dimensions in your reporting. They allow you to filter data down to specific categories, such as:
- Stage
- Channel
- Platform
- Type
- Country
- Region
- Campaign
- Audience
Having these additional dimensions to filter reports helps you break down the data further and identify what drives performance.
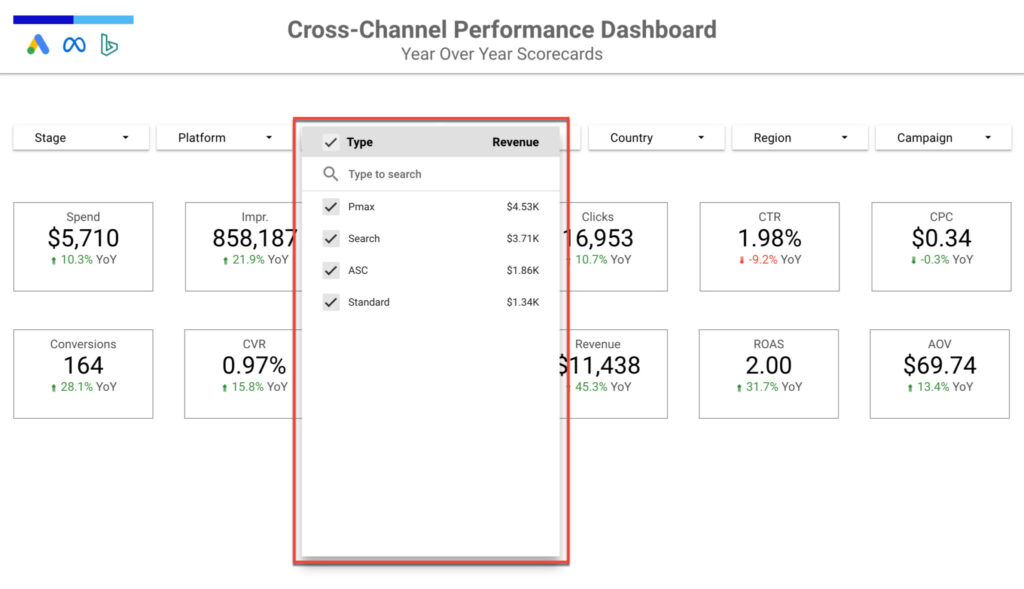
Creating Custom Dimensions in Google Sheets
One approach is to apply all the logic for your custom dimensions in the raw data table connected to Looker Studio, as I did in this Looker Studio Dashboard built with Google Sheets and Supermetrics.
In this example, Google Sheets serves as the raw data table. I use nested array formulas to create a column for each dimension, enabling these dimensions to be added as drop-downs when connected to Looker Studio.
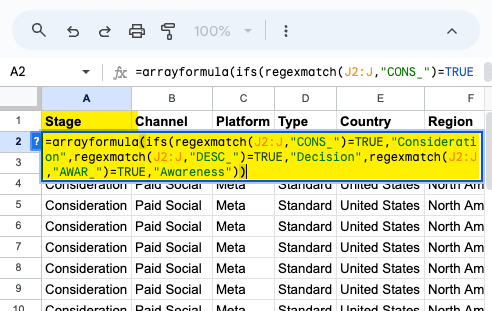
If you prefer working directly in Looker Studio rather than Google Sheets, you can connect the raw data table without the custom dimension columns and then create custom dimensions using custom groups directly in Looker Studio.
Creating Custom Groups in Looker Studio
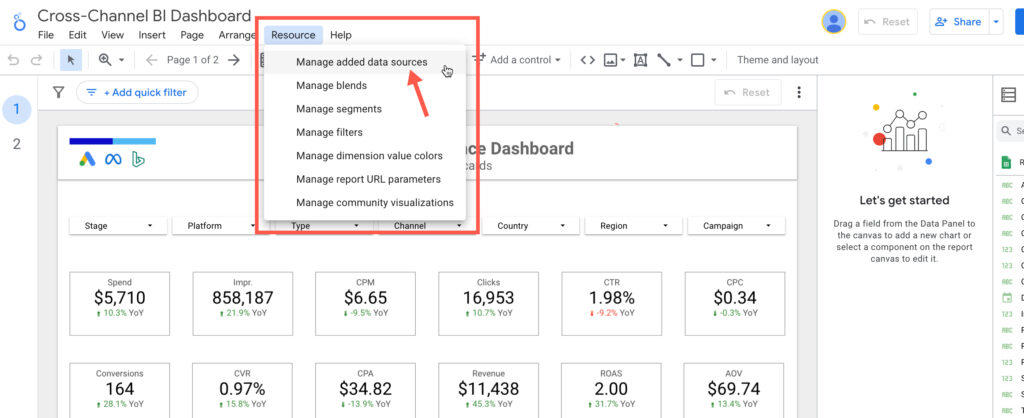
Once you have your data source connected in Looker Studio navigate to Resource and Click on Manage added data sources
Then in your desired data source under Action click Edit

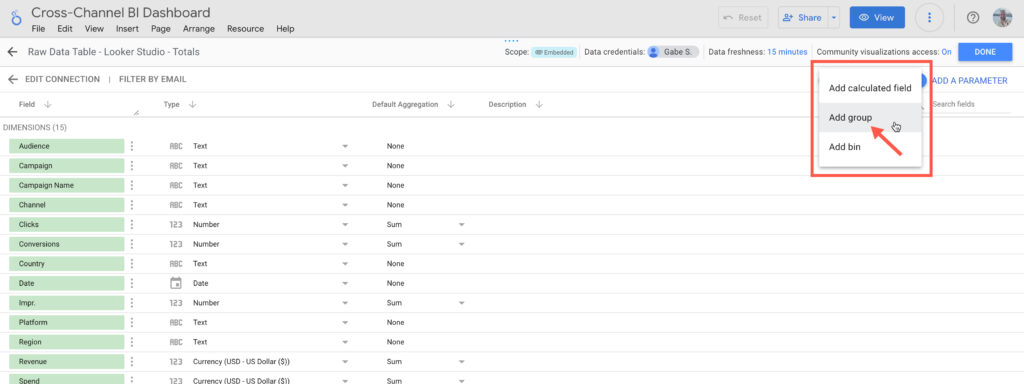
Now navigate to ADD FIELD
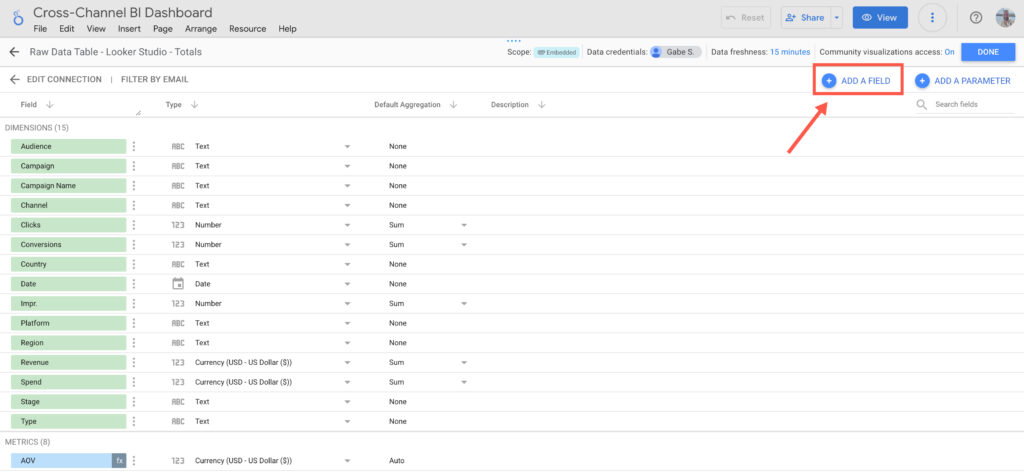
And click on Add group
Defining Conditions For Your Custom Groups
Under the Selected field to group by we are going to select the Campaign Name field since the campaign name can be parsed to define the custom dimensions we listed above.
Under New field name give the the name Stage.
Now create one group for each stage:
- Awareness
- Consideration
- Decision
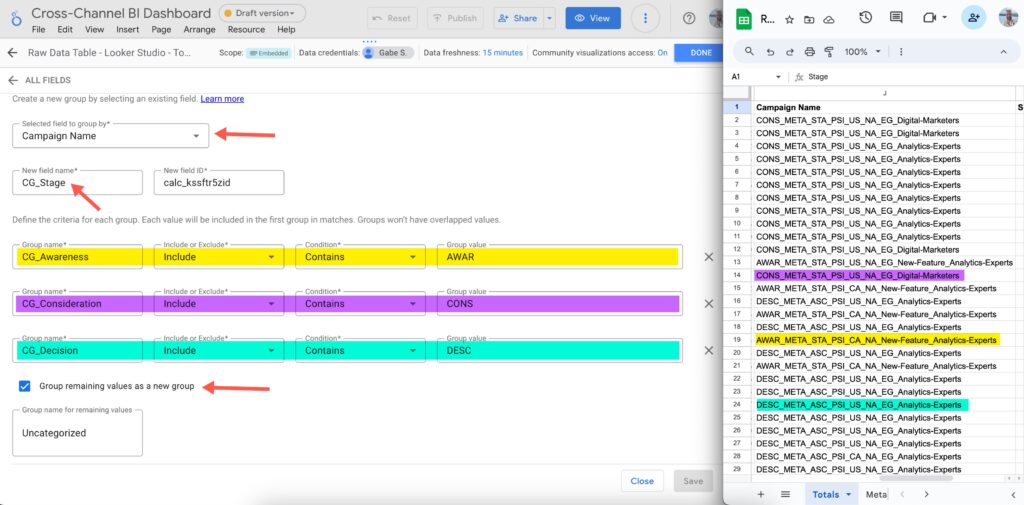
Check the box for Group remaining values as a new group and call this group Uncategorized. This way it is easy to identify campaigns that need to follow the naming conventions in your data set.
Once complete click Save.
Using Custom Groups in Reports
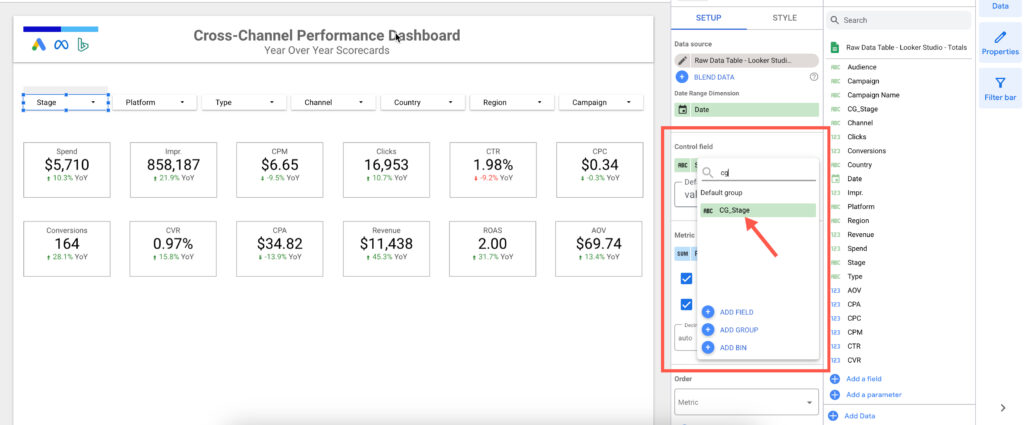
Now that your custom groups are saved you can easily access them in your Looker Studio reports. In this example, I want to Stage to a Drop-down list control. To do this I simply look for our new custom group to define the Control field.
Modifying and Updating Custom Groups
To modify or update your custom group in the Control sidebar under Data source click the pencil icon to edit the Data source.
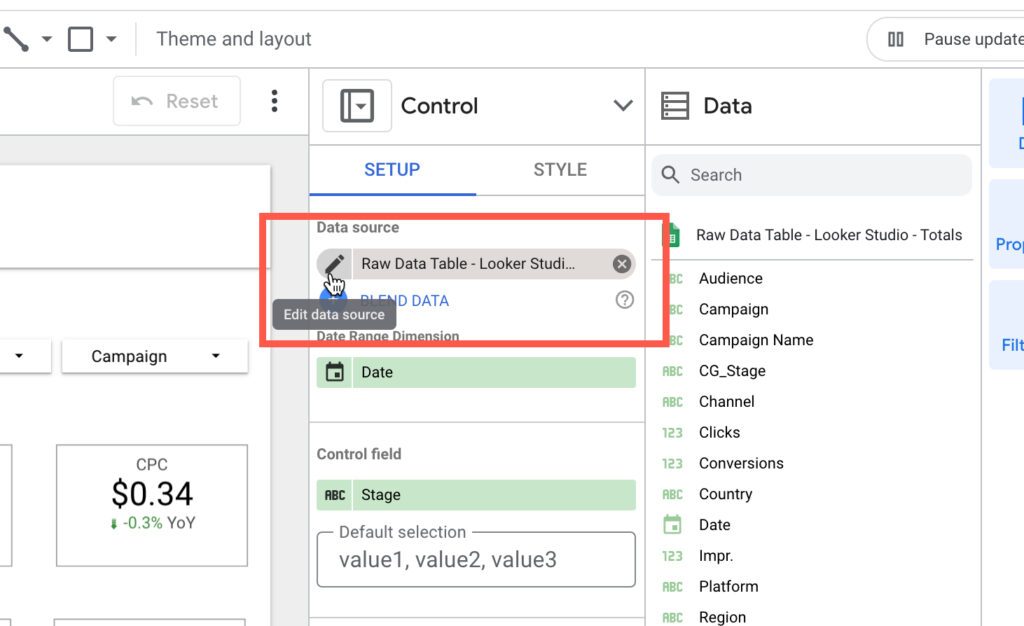
Locate your custom group under DIMENSIONS and click on fx to edit
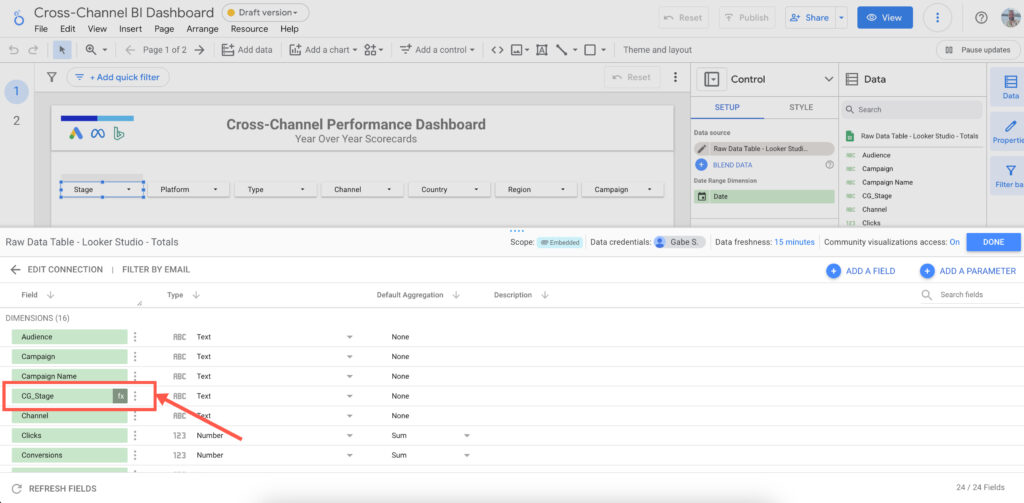
Now you can make any changes or updates as needed.
Conclusion
Creating custom groups in Looker Studio allows you to tailor your data reports to better understand your performance drivers. Whether you choose to implement custom dimensions directly in Looker Studio or use Google Sheets to prepare your data, both methods provide valuable insights. By following these steps, you can enhance your reporting capabilities and make more informed decisions based on detailed, segmented data.
AUTHOR BIO:

With over a decade of digital marketing experience, Gabe excels in search, display, and social advertising across various industries. He specializes in performance media and data-driven storytelling, building custom digital ecosystems that enhance user experiences across both paid and owned channels. Connect with Gabe on LinkedIn or explore more of his articles here.
Leave a comment