Stop Relying on Facebook for Accurate Reporting. Build a Facebook Ads Dashboard in Google Analytics Instead.
Savvy Facebook marketers have adapted and are leaning in on UTM tracking and Google Analytics reporting. Google Analytics can be daunting with the wealth of data it provides. We are here to give you a simple step-by-step guide on how you can build a Facebook Ads Dashboard for E-commerce in Google Analytics that you can access in a few simple clicks.
Building a Facebook Ads Dashboard within the Ads Manager used to be all you needed for Facebook Ads performance reporting and optimization. However, since Facebook transitioned to an aggregated event measurement model and removed conversion reporting for breakdowns the Facebook Ads Manager does not provide the reporting granularity or accuracy it once did.
Google Analytics Custom Facebook Ads Dashboards
There are two types of Google Analytics reports you can leverage to build a Facebook Ads dashboard. Dashboard and Custom Reports.
Firstly, we have custom dashboards. A Facebook ads campaign performance dashboard is ideal for daily check-ins on Facebook campaigns and to monitor overall Facebook ads performance trends.
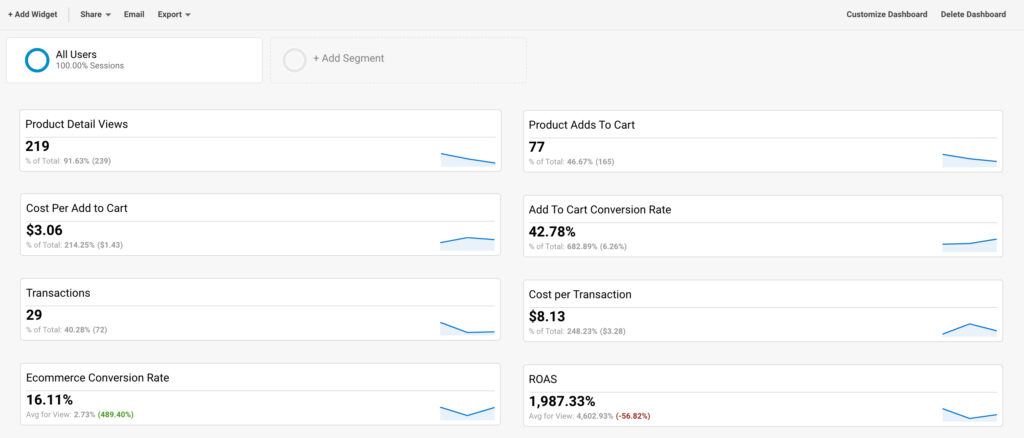
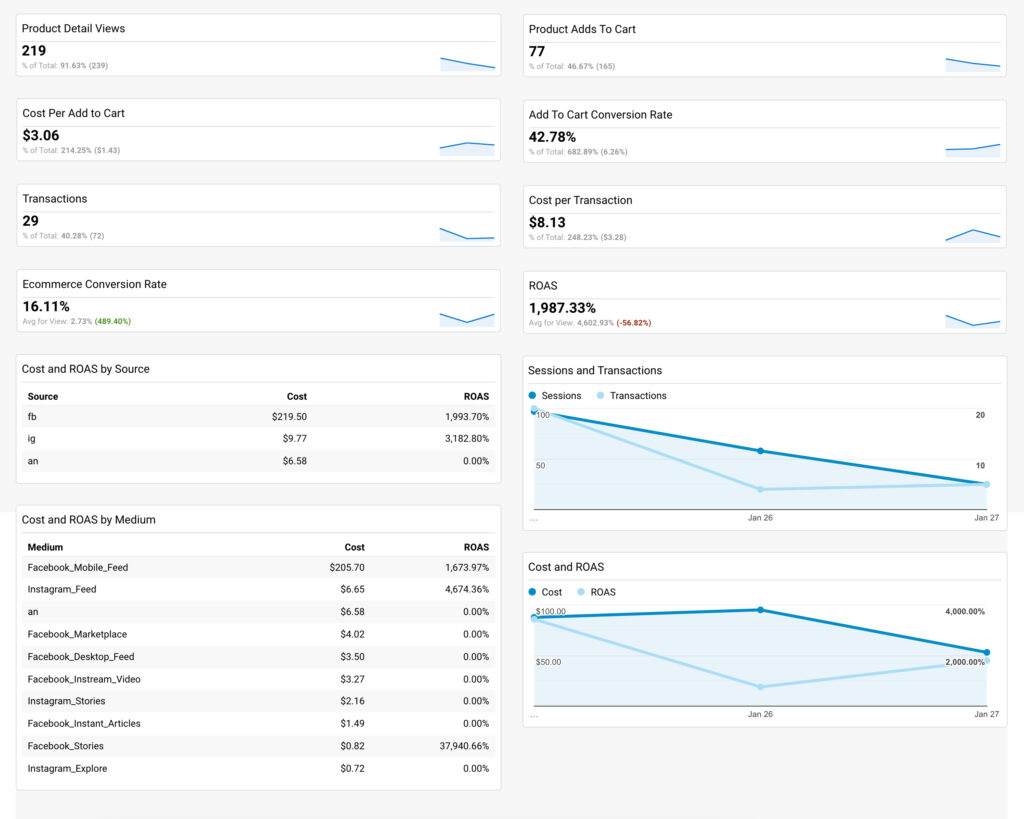
In this Facebook Ads Dashboard example, we built a scorecard dashboard that monitors trends for key performance metrics using Metrics Widgets.
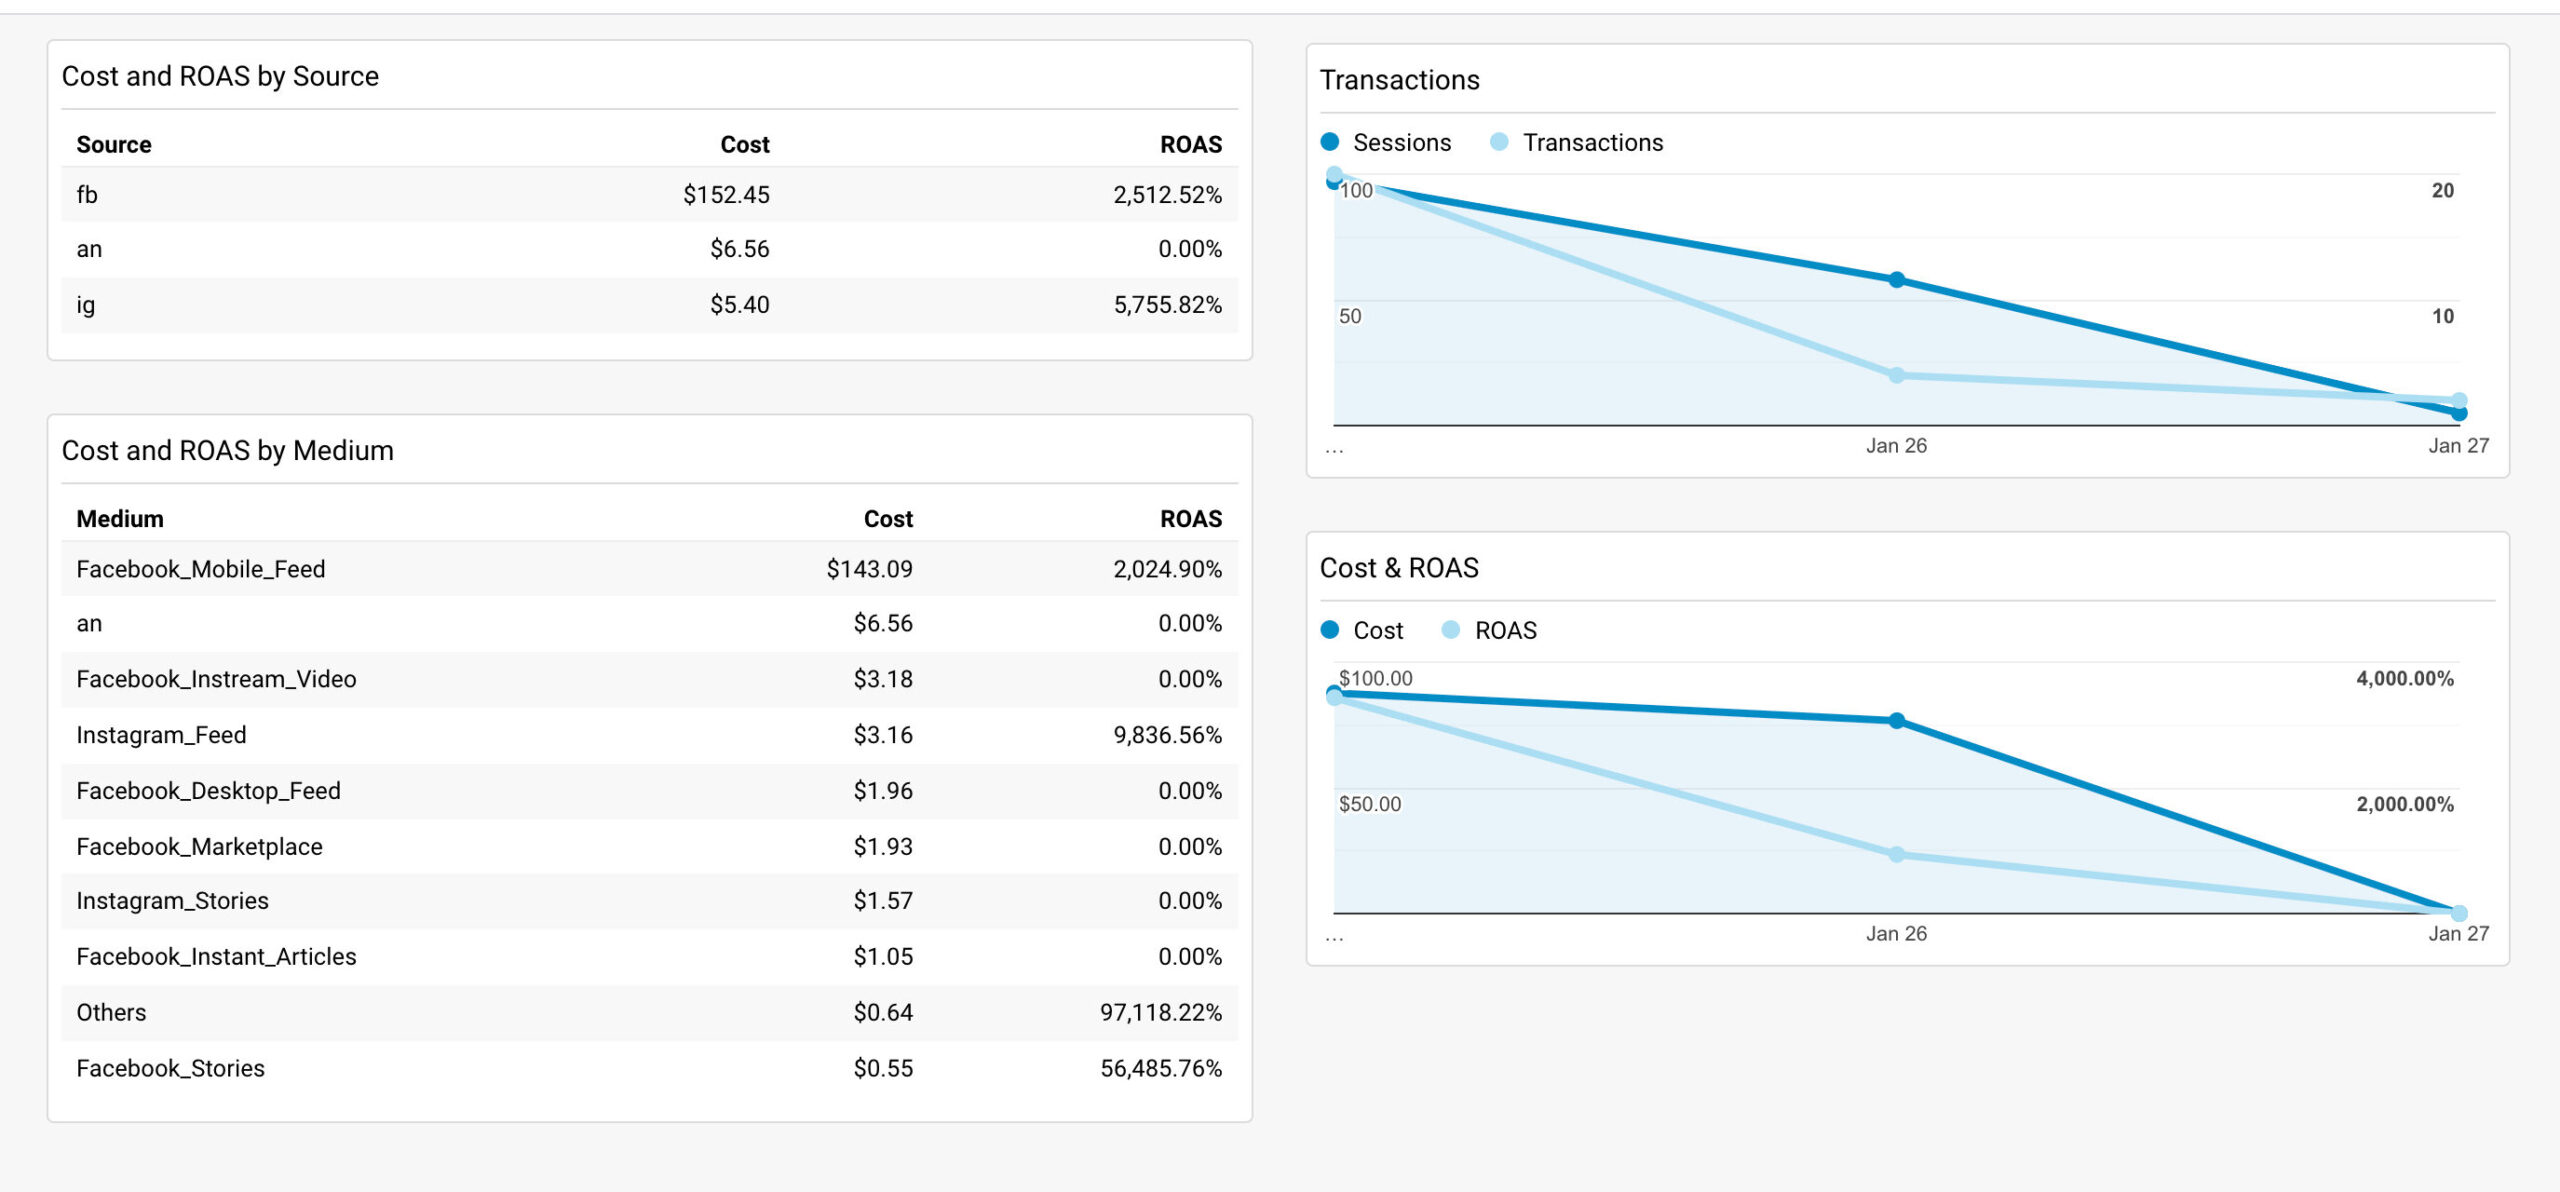
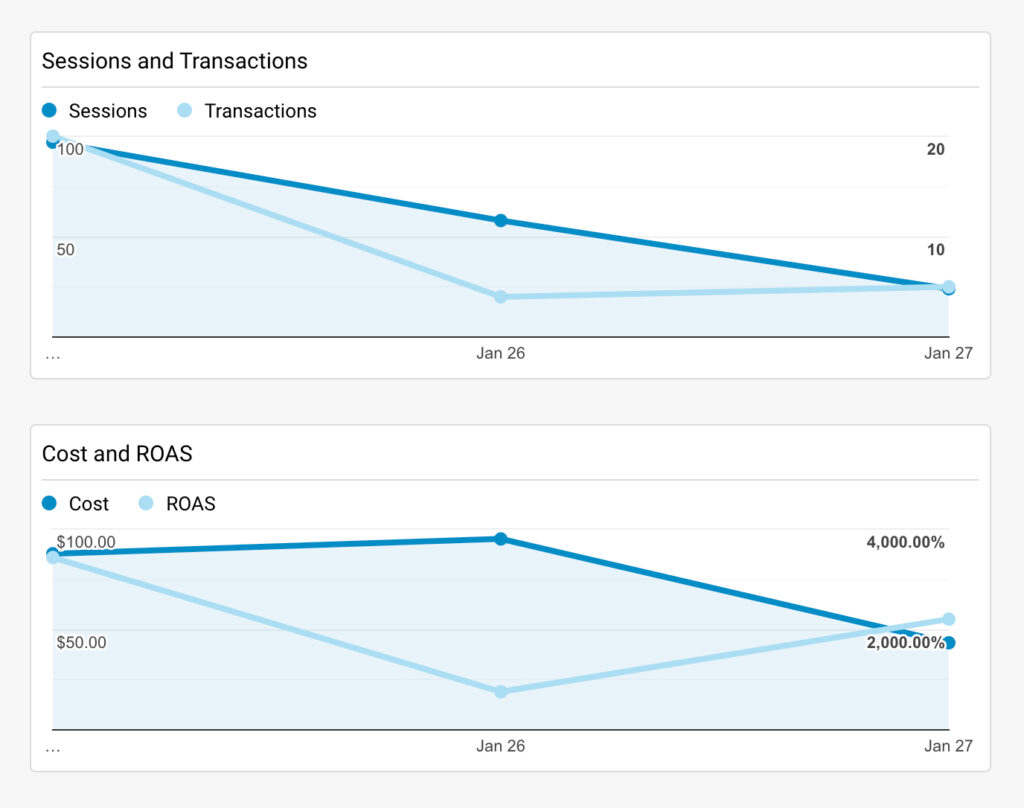
In addition, we created a Facebook Ads reporting dashboard using Table and Timeline Widgets:
- Table widgets to view ROAS performance by site_source (utm_source) and placement (utm_medium).
- Timeline widgets to view Transaction volume and ROAS performance over time.
Google Analytics dashboards are great to monitor performance trends over time. However, you are limited to the number of fields per widget and the total number of widgets you can add to a dashboard. This takes us to custom reports.
Google Analytics Custom Reports
Secondly, we have custom reports. They are ideal for analysis and optimization. You can use these reports to dig deeper into performance and analyze results on the site_source, placement, campaign, ad set, and ad breakdown.
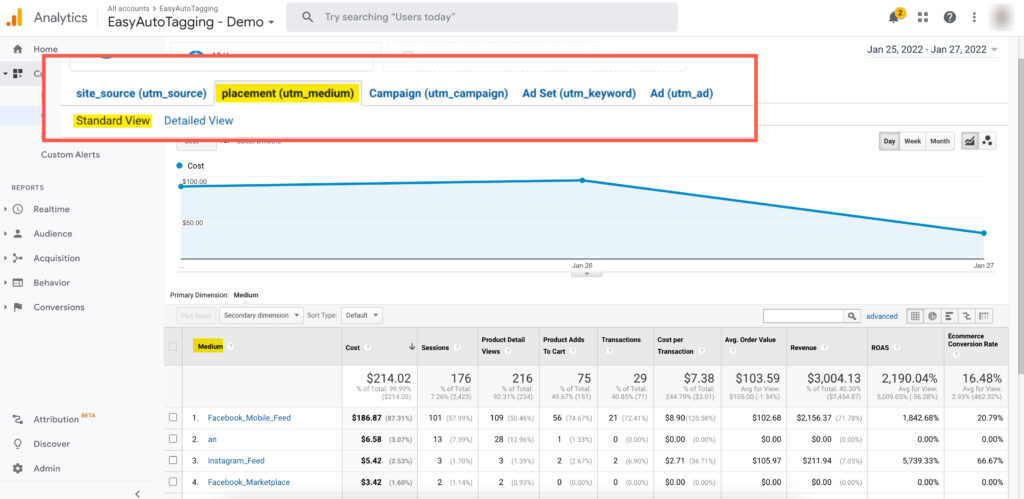
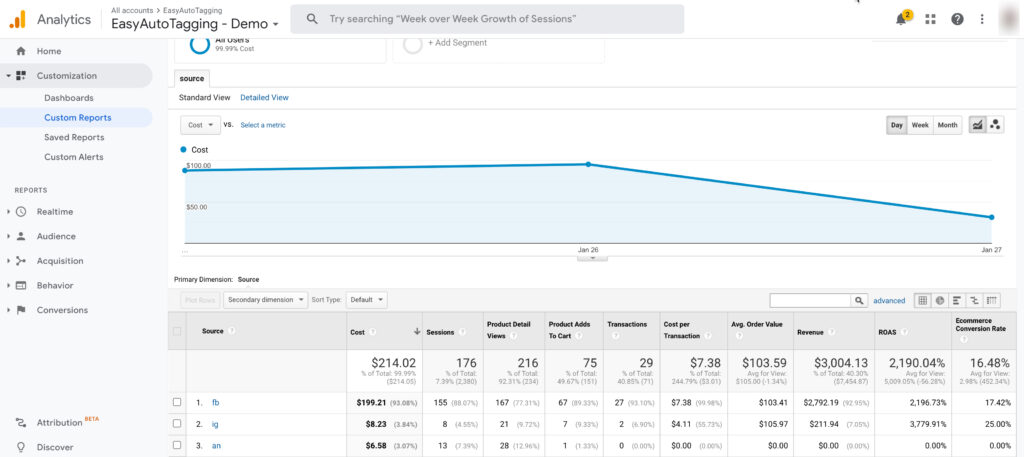
This example shows a custom report filtered to paid Facebook traffic that gives us cost, sessions, and detailed E-commerce metrics. This table view is great because you can include all of your key reporting metrics for analysis. We have also created pre-defined site_source, placement, Campaign, Ad Set, and Ad views.
Requirements to Build an E-commerce Facebook Ads Dashboard
To measure Facebook Ads CPA and ROAS performance in Google Analytics using custom reports and custom dashboards four things need to be in place:
1. Add UTM Tags to all Facebook ads. URL Parameters are used in Google Analytics to attribute sessions and conversions back to users that reached your site from specific Facebook Campaigns, Ad Sets and Ads. *You can automate this process with EasyAutoTagging.
2. Enhanced E-commerce tracking is required so that you can utilize Google Analytics E-commerce reporting metrics. If you need to implement Enhanced E-Commerce tracking you can reference a guide from Measure School here.
3. Import Facebook ads cost data. Facebook ad Cost Data Imports brings your spend data into Google Analytics. You can leverage a tool like ours to automatically import cost data daily or multiple times per day. If you automate this process or apply manual imports the key is to format your import schema to match your URL Parameter structure. This is imperative for cost data to blend with Google Analytics session data. You can learn more about automatic cost data blending here.
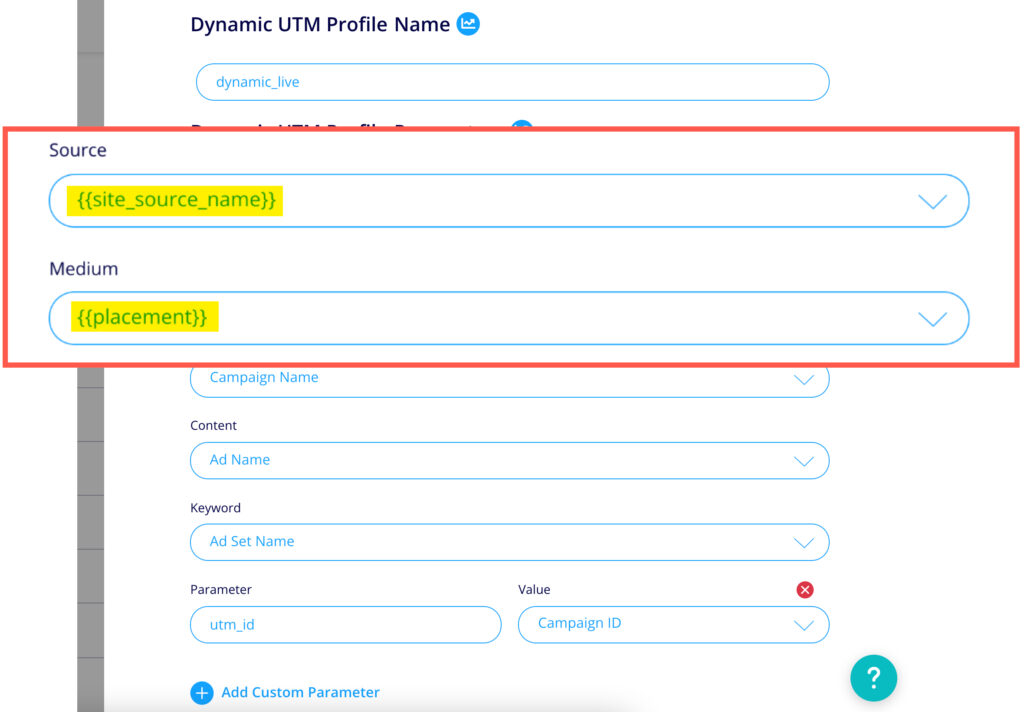
4. Leverage Dynamic UTM Profiles so that you can measure conversions, CPA, and ROAS on the site_source and placement breakdowns in Google Analytics. You can learn more about Dynamic UTM Profiles here.
Getting Started with the Standard Cost Analysis Report
To get started, navigate to the standard Cost Analysis report in Google Analytics. Head over to Acquisition > Campaigns > Cost Analysis then click on edit in the top right corner.
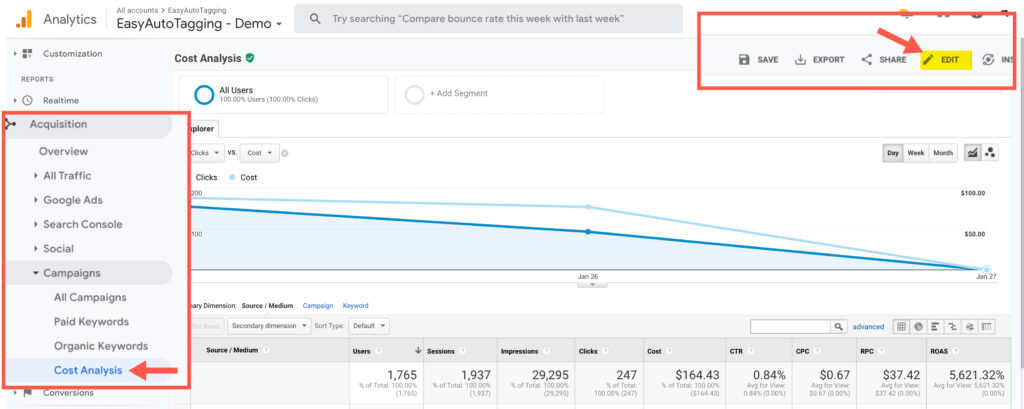
We can use the standard Cost Analysis report as our baseline to build our custom Facebook Ads dashboard report.
First, let’s rename this report and call it Facebook Ads Dashboard for E-commerce. Let’s also rename the custom reports tab and call it source.
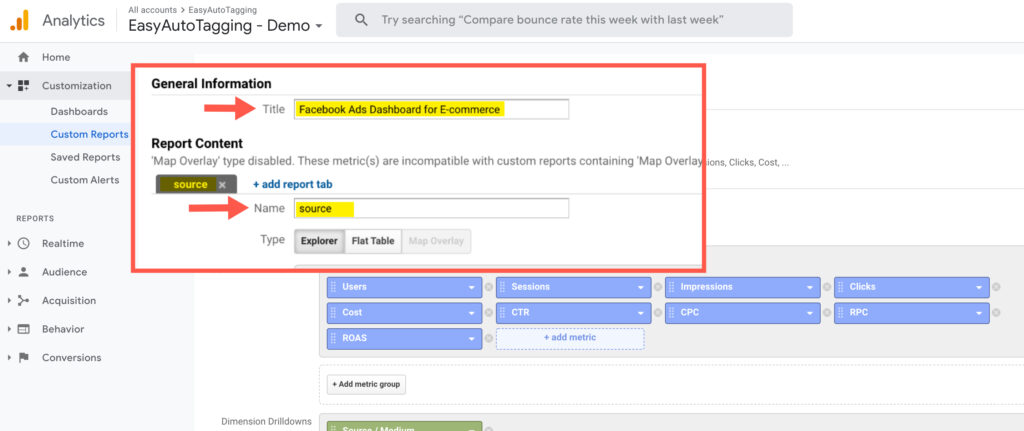
Defining Dimensions and Applying Report Filters
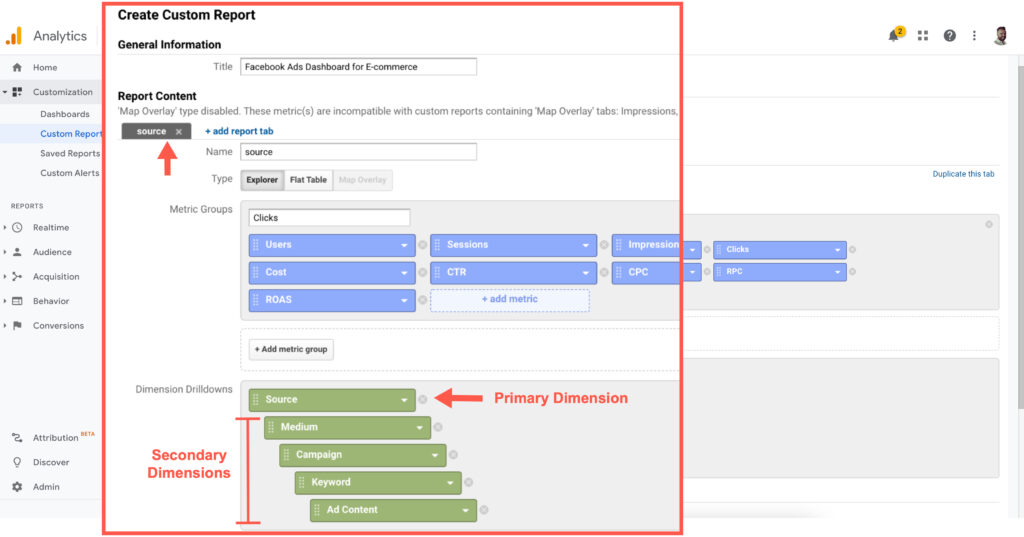
We are going to create one report tab for each primary dimension. You can add additional dimensions to each tab so that you can use them as a secondary dimension when accessing the report.
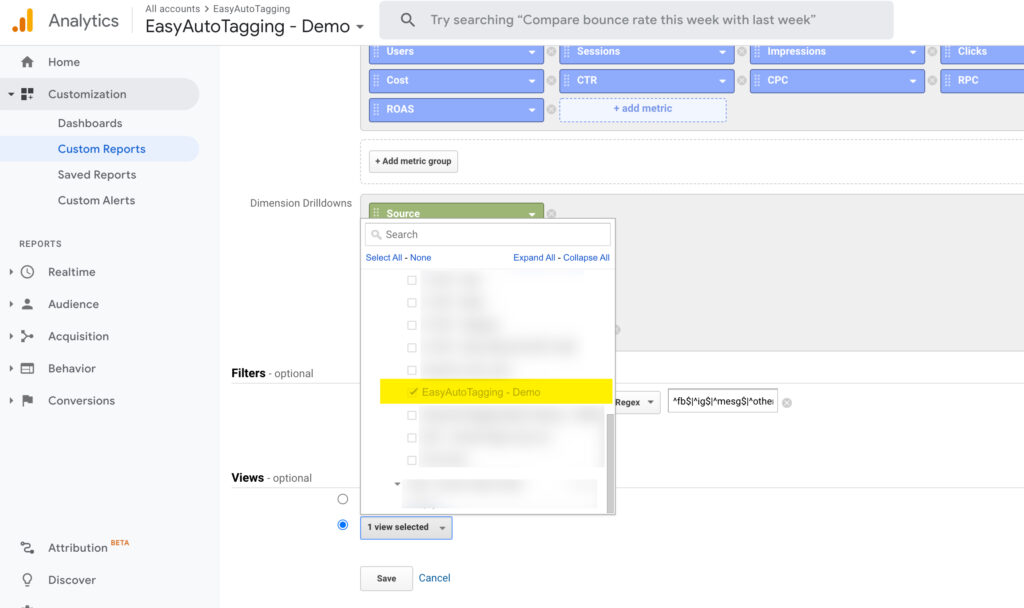
Next, we want to filter our custom report to only include traffic coming from Facebook ads. We are going to set the filter on the source dimension. In this case, we are leveraging Dynamic UTM Profiles as you can see here.
That means our possible values for Facebook Ads traffic are fb, ig, msg, other, and, an. So let’s use a regular expression filter to include only sessions from these sources.
^fb$|^ig$|^msg$|^other$|^an$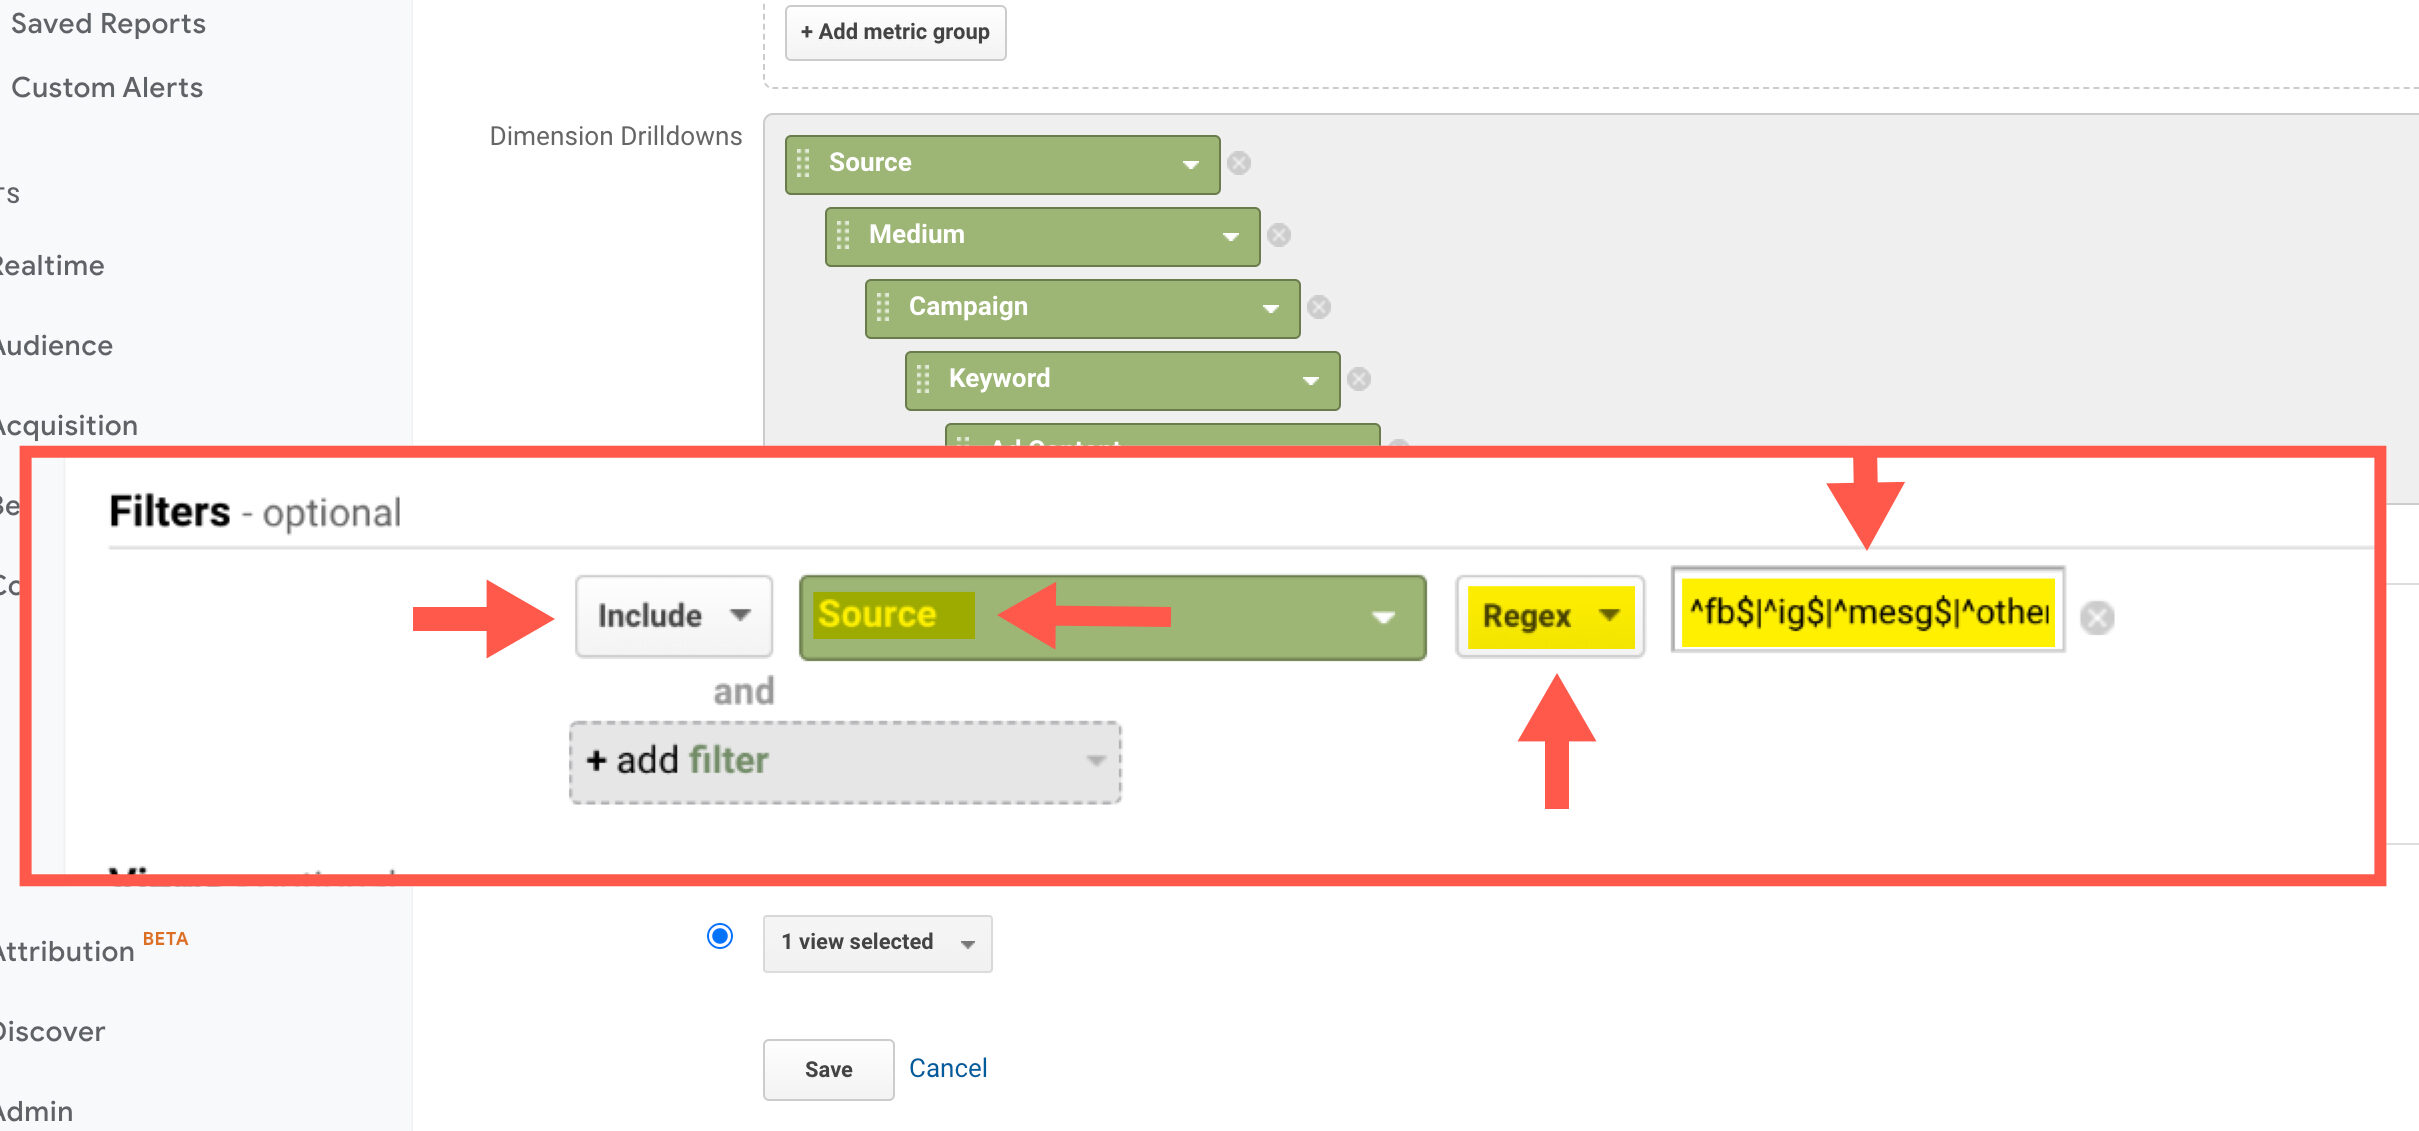
Don’t forget to the select the view where this custom report becomes available and make sure the view you select is also the view associated with your cost data set.
Grouping Metrics
Next, we are going to configure two metric groups that we can duplicate across report tabs.
Remove all metrics and replace the current metrics with key E-commerce performance metrics. We will be using a combination of standard Google Analytics and Calculated Metrics for our Facebook Ads Dashboard.
First, we are going to add standard E-commerce metrics. Go ahead and add Cost, Sessions, Product Detail Views, Product Adds To Cart, Transactions, Cost Per Transaction, Average Order Value, Revenue, ROAS, and E-commerce Conversion Rates.
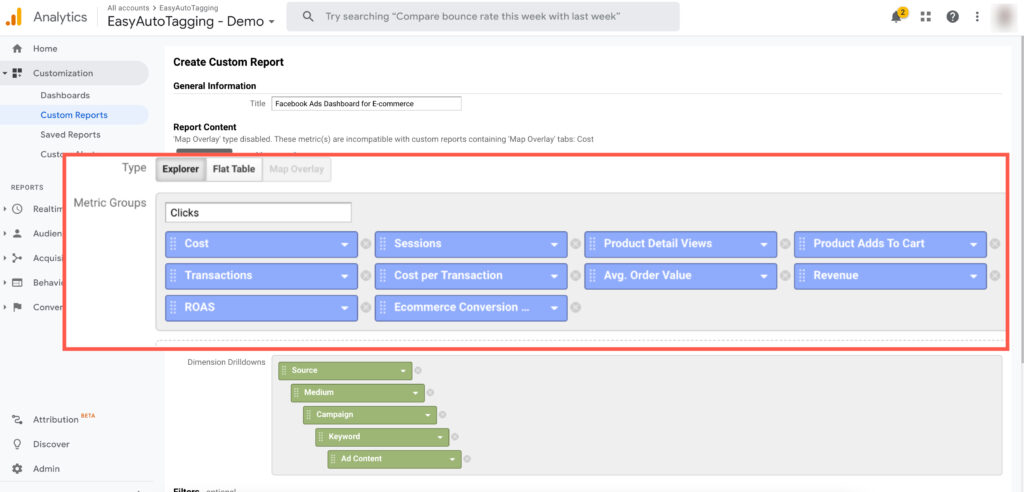
These metrics are a solid start. However, there are a couple of missing metrics. These are Add To Cart Conversion Rate and Cost Per Add to Cart. We are going to create these by leveraging Calculated Metrics.
Creating Calculated Metrics
You can access Calculated Metrics on the view level in your admin section.
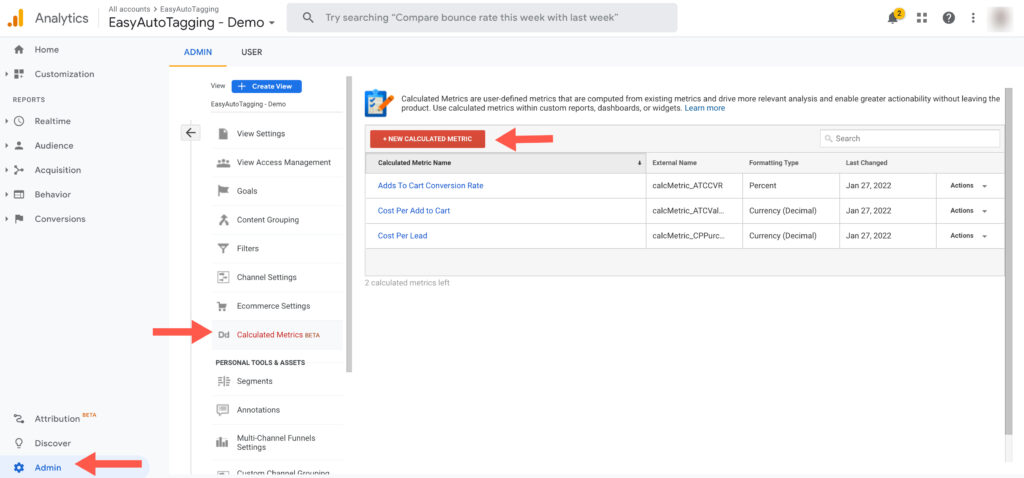
Let’s go ahead and create calculated metrics for Add To Cart Conversion Rate and Cost Per Add to Cart.
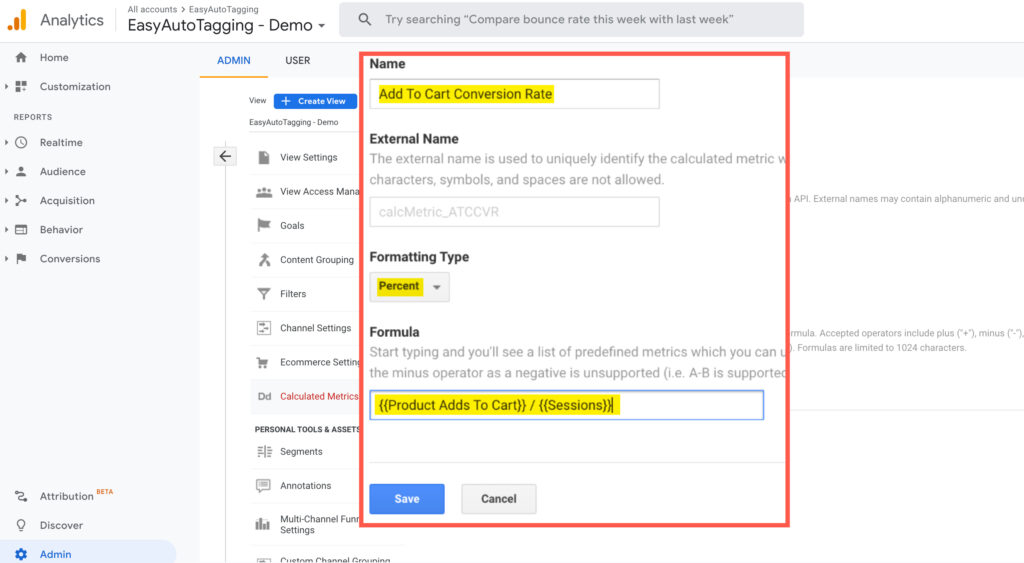
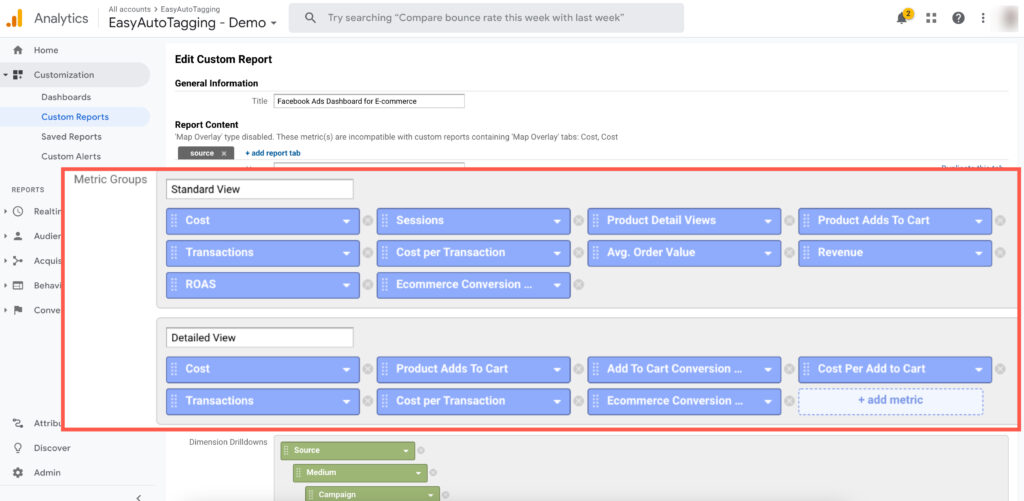
Once you have these created you can go back to your custom report. We are limited to 10 metrics for each metric group so let’s call the first metric group Standard View, create a new metrics group, and call it Detailed View.
Now let’s add Cost, Product Adds To Cart, Add To Cart Conversion Rate, Cost Per Add To Cart, Transactions, Cost per Transactions, and E-commerce Conversion Rates.
This gives us a nice Facebook Ad Dashboard custom report we can use for analysis on the source breakdown.
However, we also want to analyze performance on the medium, campaign, ad content, and ad level breakdowns. To do this we are going to leverage reporting views within custom reports.
Adding Breakdown Views To Your Facebook Ads Dashboard
To complete our custom E-commerce Facebook Ads Dashboard we are going to create additional report tabs for the medium, campaign, ad set, and ad.
To do this duplicate the current tab.
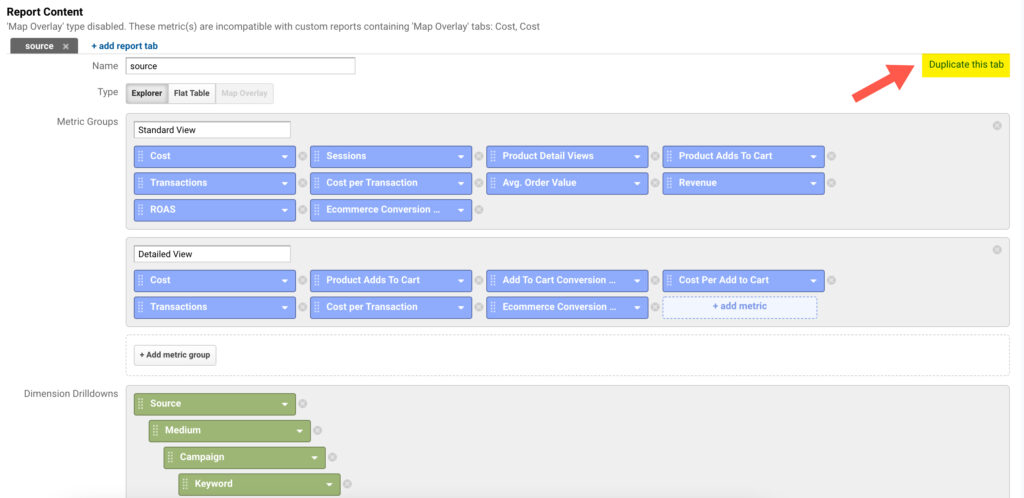
Then update the name and change the primary dimension and dimension drill-down for each tab respectively. Your end result should look like this.
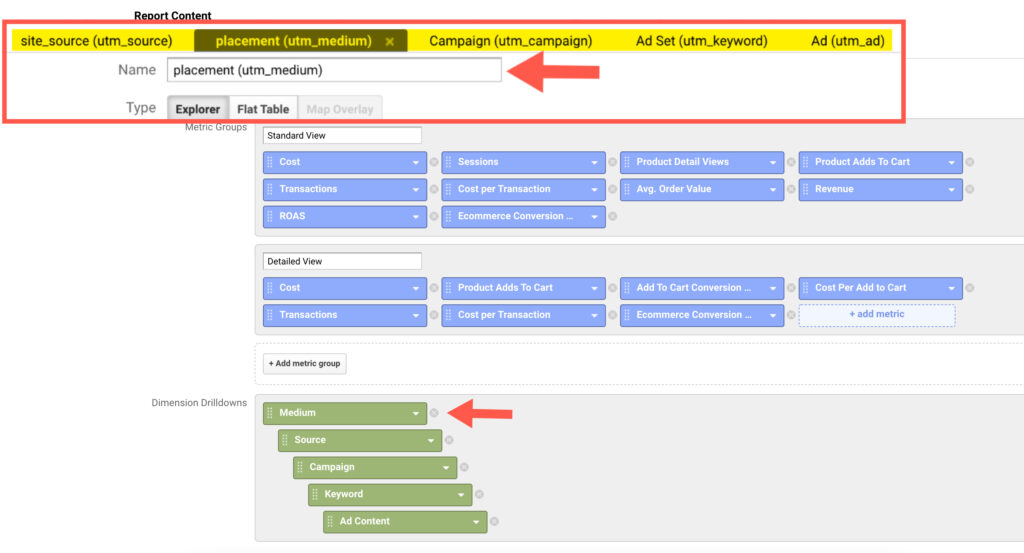
A quick note: Cost data imports are joined on the date level not the session, product, or hit level. This means that your reports are restricted to the five standard Google Analytics dimensions you can pass through URL Parameters: utm_source, utm_medium, utm_campaign, utm_content, and utm_keyword. Since Facebook Ads does not use keywords for targeting, we can leverage this parameter and pass the Ad Set Name to capture audience data in Google Analytics.
Hit save and you now have a complete Facebook Ads Dashboard for E-commerce where you can measure, analyze and optimize Facebook Ads ROAS and CPA on the site_source, placement, Campaign, Ad Set, and Ad level.
Note: Since data is joined on the date level you can apply Google Analytics Segments to these reports but it will break the cost data join.
You can import the template for this custom report from the Google Analytics Solutions Gallery here.
Building Google Analytics Facebook Ads Dashboard
Now that we have the foundation in place let’s explore dashboards. Dashboards are a great way to check in on high-level performance trends. A Facebook Ads Dashboard can also function well as client-facing reports for your more hands-on accounts.
We are going to create a Facebook Ads Dashboard including key performance metrics and trends like the one below. The goal is to show you what can be done with Google Analytics Dashboards and you can then customize them to your needs.
A couple of things to keep in mind:
You are limited to the number of metrics you can add to each widget.
You are limited to 12 widgets for each dashboard.
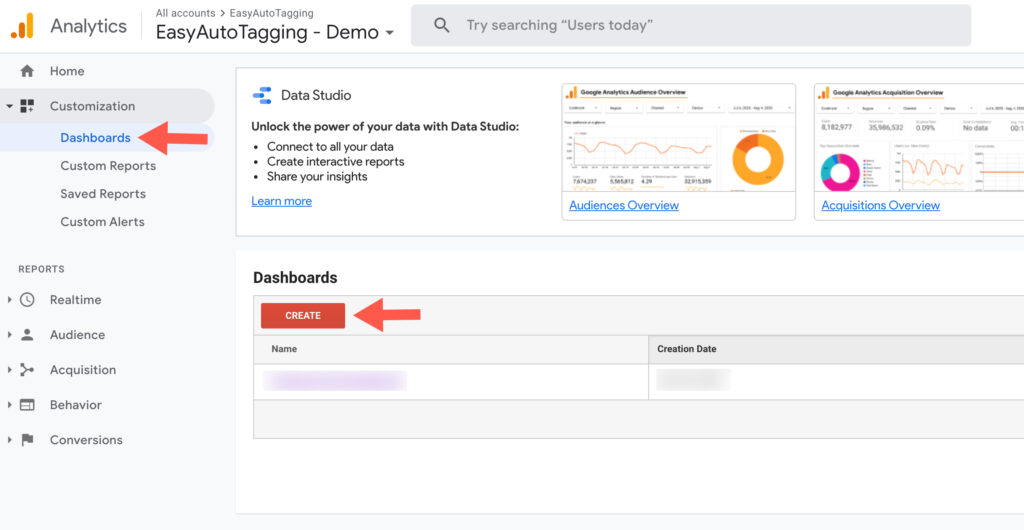
To get started head over to Dashboards in the Google Analytics customization section and click on Create.
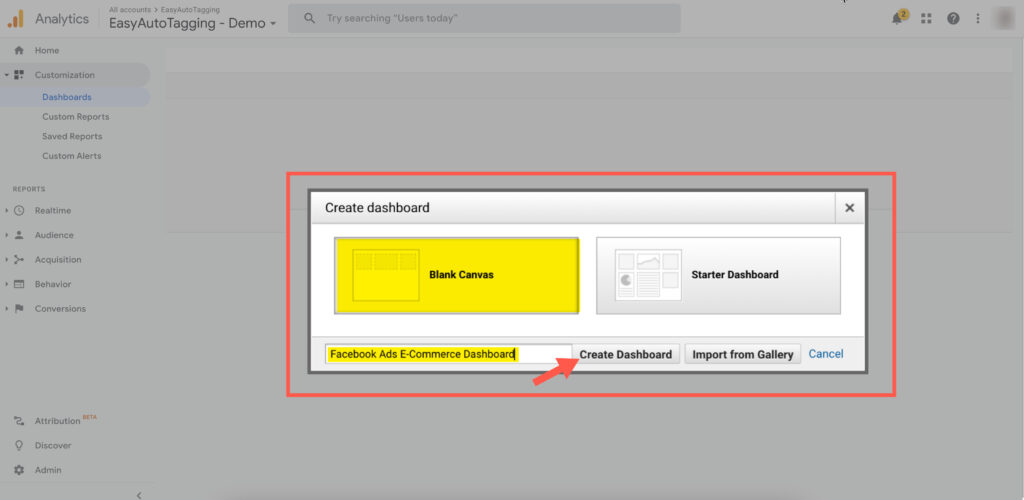
Then select Blank Canvas, call it Facebook Ads Dashboard, and click Create Dashboard.
Now let’s customize our dashboard in Google Analytics.
Creating Scorecard (Metric) Widgets
First, we are going to create scorecards for Product Detail View, Product Adds To Cart, Add To Cart Conversion Rate, Cost Per Add To Cart, Transactions, Cost per Transactions, E-commerce Conversion Rates, and ROAS.
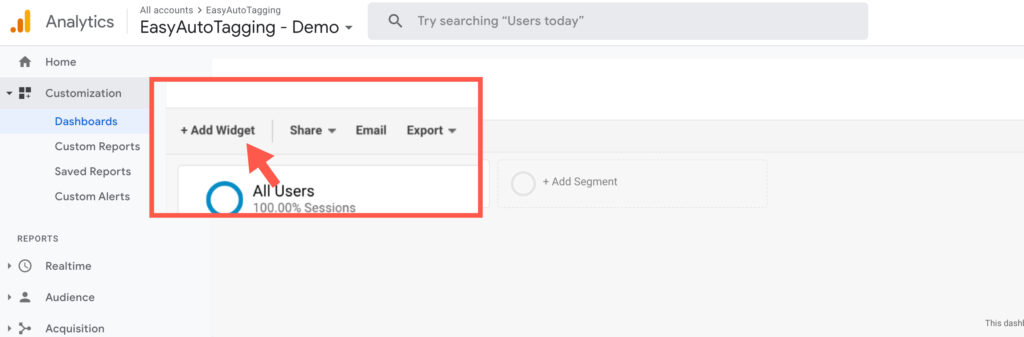
In the top left click on +Add Widget
In the standard row select Metric. For the metric select Product Detailed Views, add a filter on the source dimension using the regular expression we applied to our custom reports above, and hit save.
^fb$|^ig$|^msg$|^other$|^an$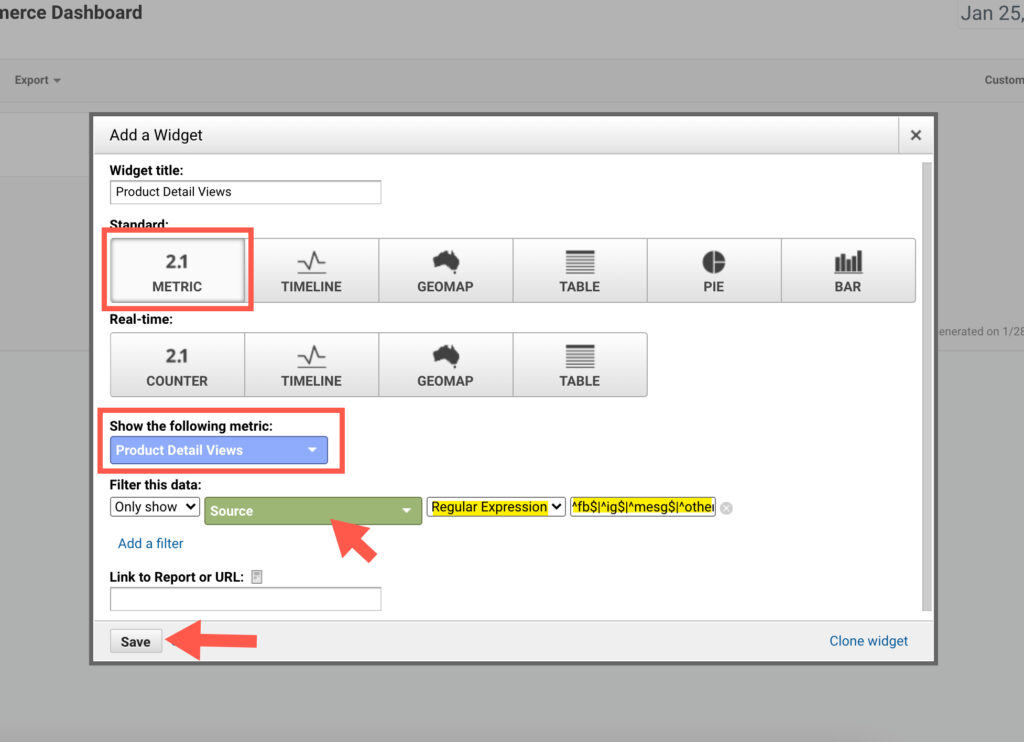
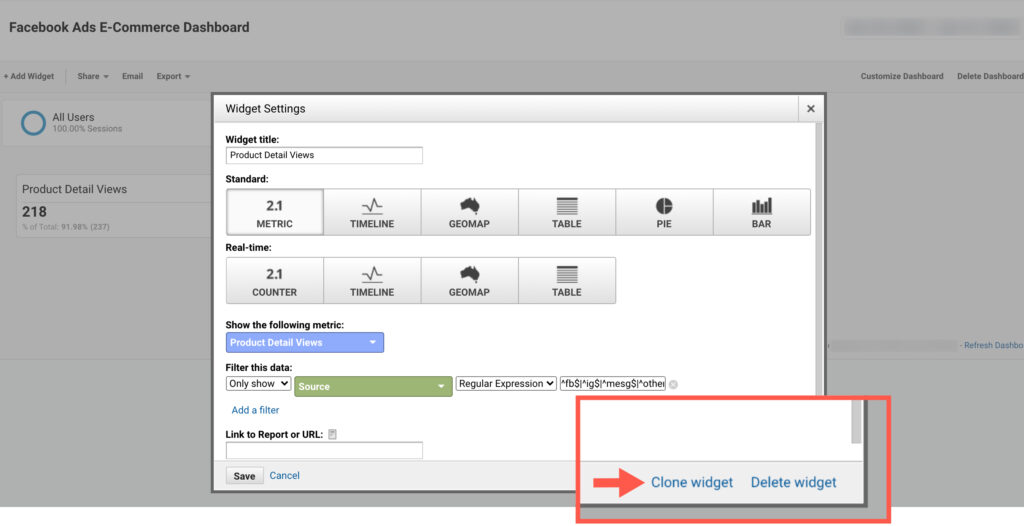
Next, hover over the widget we just created and click on the edit icon. Then click on Clone Widget in the bottom right corner of the pop-up.
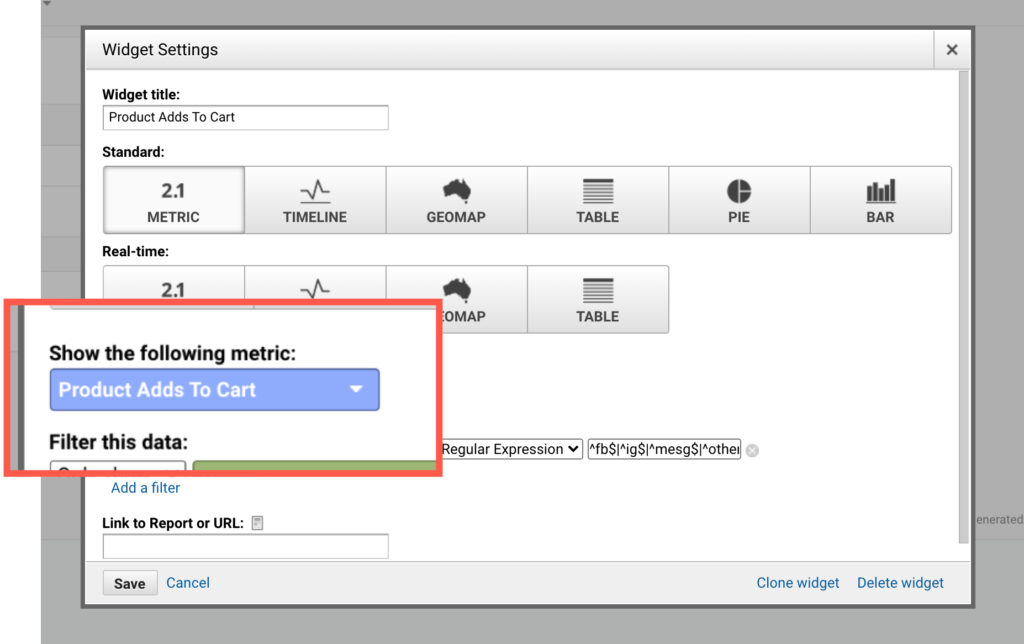
Now go back into the cloned widget and change the metric to Product Adds To Cart.
Repeat the same steps to create widgets for Add To Cart Conversion Rate, Cost Per Add To Cart, Transactions, Cost per Transactions, E-commerce Conversion Rates, and ROAS.
Adding Performance Trend Timeline Widgets
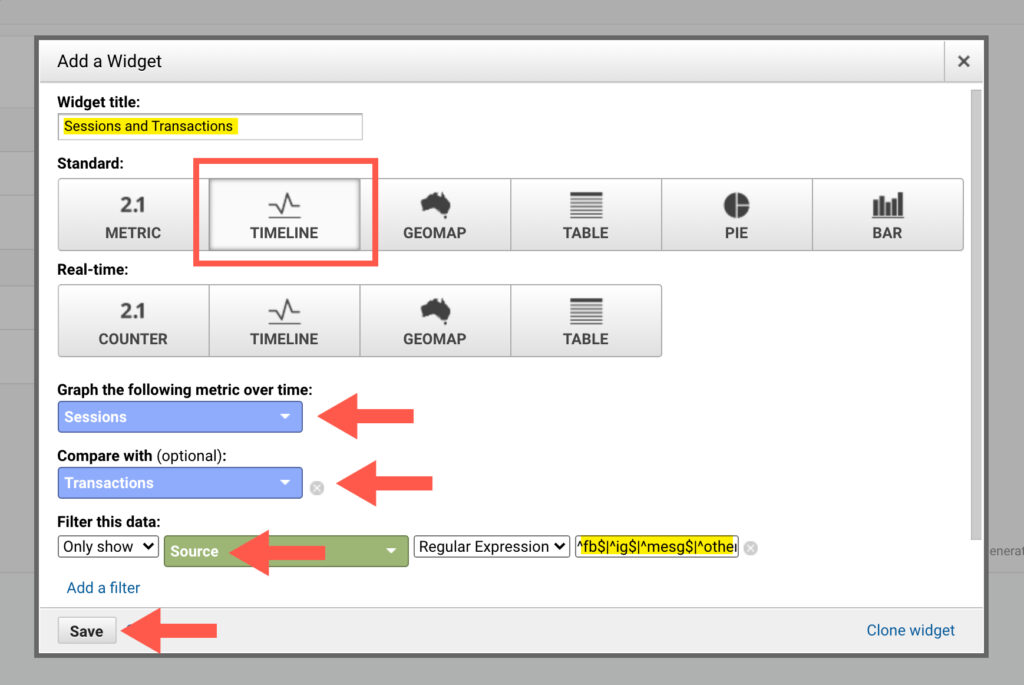
Next, we are going to create a transaction trends table. In the Standard row select the Timeline widget. Apply the same filter we used for the custom report using regular expression. Then let’s add two metrics; Sessions and Transactions.
Now let’s go ahead and graph a Cost and ROAS timeline. Clone the Sessions and Transaction widget. Then edit the cloned widget and change Sessions to Cost and Transactions to ROAS.
This gives you two trending graphs that you can use to monitor transactions and transaction efficiency over time.
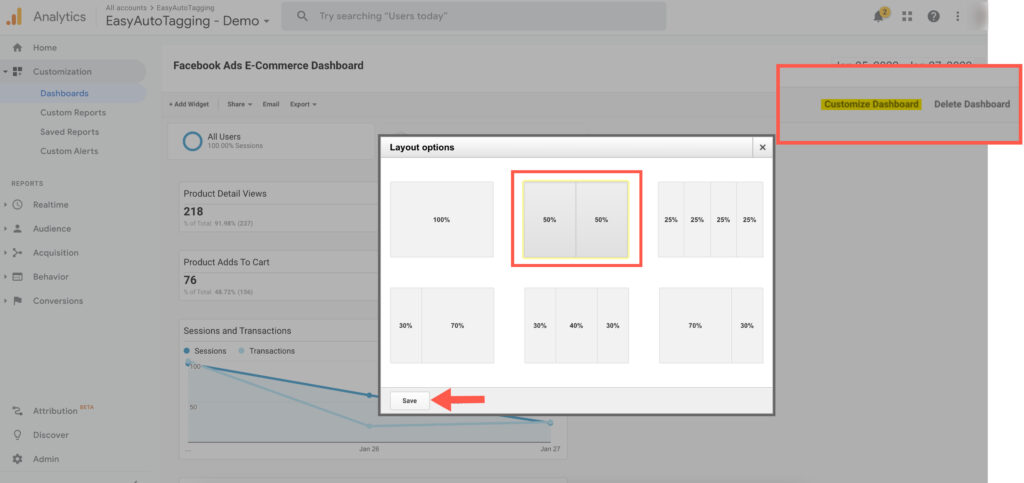
Customizing Your Facebook Ads Dashboard Layout
Before we continue, let’s configure our dashboards widgets. In the top right corner click on Customize Dashboard. For this dashboard, we are going to select the 50% / 50% layout.
Creating Table Widgets
We are going to add two more table widgets. One to view site_source breakdowns using the Google Analytics source dimension. The second is to view placement breakdowns using the Google Analytics medium dimension.
Create a new widget and select Table in the Standard row. Apply the regular expression filter we used above, then select source for your dimension and Cost and ROAS for your metrics and click save.
^fb$|^ig$|^msg$|^other$|^an$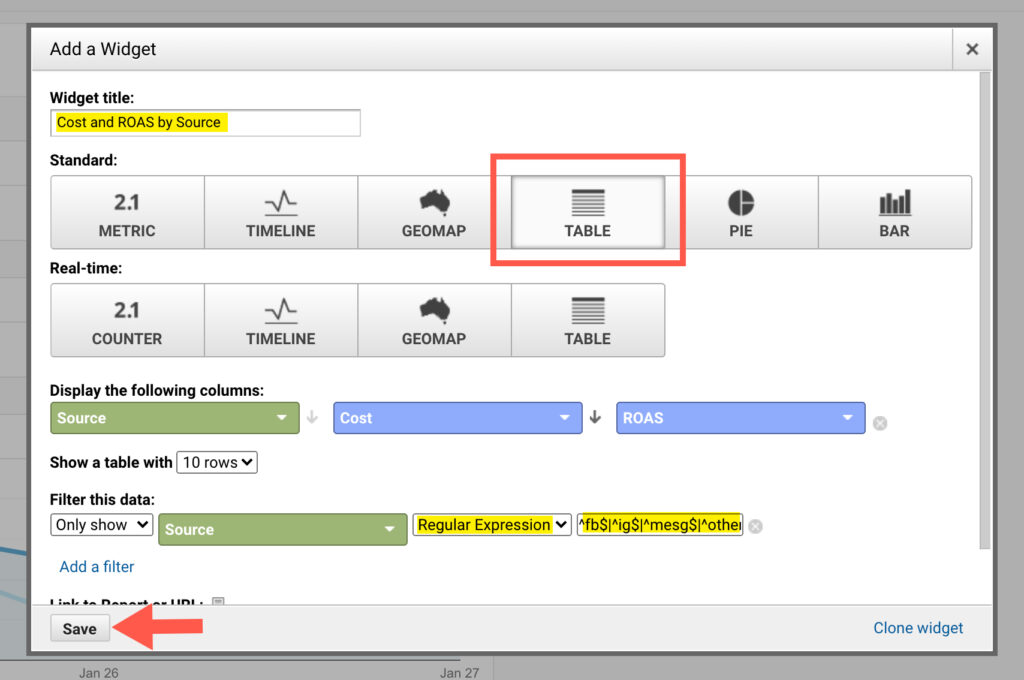
Next, hover over the widget we just created and click on the edit icon. Then click on Clone Widget in the bottom right corner of the pop-up. Go back into the cloned widget and change the dimension to medium.
Now you have a compete Facebook Ads Dashboard to monitor Facebook Ads performance trends.
You can import the template for this custom dashboard from the Google Analytics Solutions Gallery here.
Conclusion
Reporting is critical to understanding and optimizing performance. The digital ecosystem is constantly changing but there are always ways we can adapt.
Google Analytics is a great resource to supercharge your reporting. Leveraging custom reports and custom dashboards can provide Facebook Ads Dashboards you can access in a few simple clicks.
How do you use Google Analytics to measure the success of Facebook campaigns? Let us know in the comments below.
Leave a comment