How To Define [Geographic] Facebook Budget Allocation
Have you ever found yourself pitching a media plan to clients and are not sure how to explain your Facebook Budget Allocation?
In fact, what is the minimum budget for Facebook ads?
Yes, Facebook has a minimum budget in terms of daily spend that you can set on the Ad Set level to as little as $5 per day.
But how can you determine if your allocated Facebook campaign budget will make the desired impact nationwide?
Digital Brand Index
This article explores measuring existing ‘digital brand index’ to determine the Facebook Ads minimum budget required to make an effective impact.
Note: For this use case we are working with brands that have national coverage.
How Does One Determine the Best Geographic Facebook Budget Allocation?
So what is a good way to identify your Facebook budget optimization for maximum impact?
If we segment every campaign by state or city our execution would become counterproductive.
However, targeting specific cities only would be too restrictive and leave opportunity on the table.
If you are working with a national brand, certain geographies must have a stronger brand saturation than others, so how can they be identified?
In addition, some areas have much stronger performing sales volume than others. How can you identify and leverage this?
Good questions, right?
Next, how does all this tie in to effectively distributing Facebook Budget Allocation across geographies?
Read on to find Facebook geographic ad budgets explained using BDI, CDI and BOI.
What is BDI, CDI and BOI?
The exact definitions are:
BDI – Brand Development Index
CDI – Category Development Index
BOI – Brand Opportunity Index
To run a BDI/CDI analysis in traditional media planning a brand manager would look at:
Nationwide Target Population
City/State Wide Target Population
Nationwide Total Brand Sales
City/State Total Brand Sales
Nationwide Total Category Sales
City/State Total Category Sales
Given this information the brand manager would be able to define brand and category index to determine brand and category areas of opportunities using the following formulas:
BDI = (Total Brand Sales Locations / Total Brand Sales Nationwide) / ( Total Target Population Local / Total Target Population Nationwide )*100
CDI = (Total Category Sales Locations / Total Category Sales Nationwide) / ( Total Target Population Local / Total Target Population Nationwide )*100
To define the opportunity index we take:
BDI / CDI * 100 = Opportunity Index
We can read the results like this:
If the value is lower than 100, we are under-indexing and there is room to grow.
But, if the value is at ~100, we have a relatively even index.
However, if the value is over 100 we are over indexing.
What the heck does this have to do with Facebook?
Read on – this is where it gets pretty neat.
Identifying Facebook Audience Opportunities
I am going to take the same approach as above using data I have sliced up building audiences on Facebook to help me determine best geographic Facebook Budget Allocations.
First, we need to collect our data so that we can run an analysis.
Let’s pick the brand Fitbit and a target audience of active millennial moms across these seven cities:
New York
Los Angeles
Chicago
Houston
Dallas
Seattle
Boulder
Referencing the traditional model above, let’s swap some values:
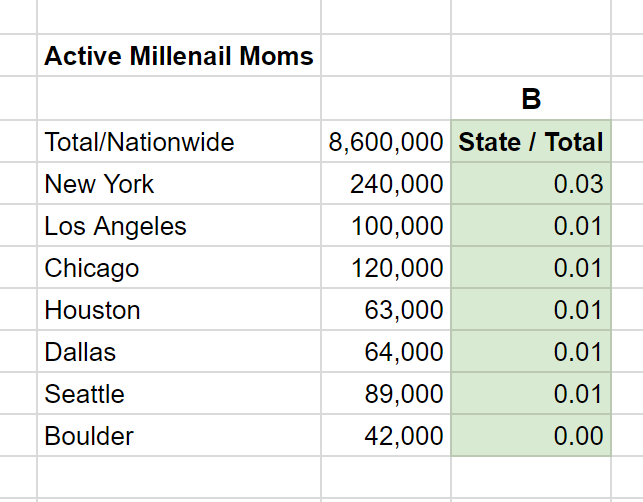
Nationwide Target Population = Active Millennial Moms Nationwide
City/State Wide Target Population = Active Millennial Moms by City
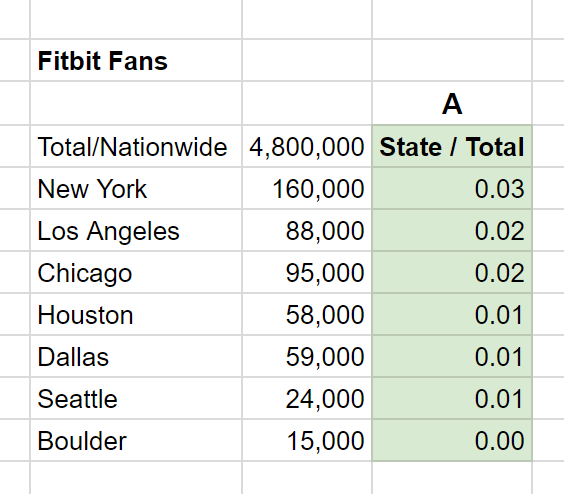
Nationwide Total Brand Sales = Fitbit Facebook Fans Nationwide
City/State Total Brand Sales = Fitbit Facebook Fans by City
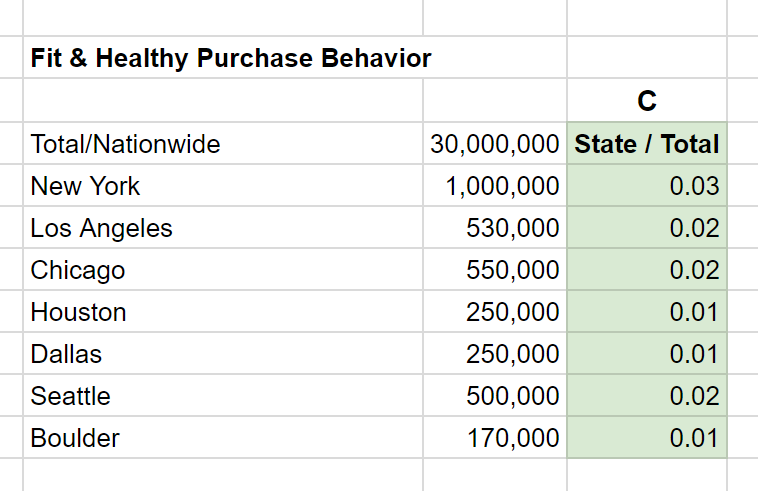
Nationwide Total Category Sales = Healthy & Fit Purchase Behavior Nationwide
City/State Total Category Sales = Healthy & Fit Purchase Behavior By City
Our target audience sizes break down like this:
Active Millennial Moms
Fitbit Fans
Healthy and Fit Purchase Behavior
Running BDI/CDI Analysis
Now that we have all of this data compiled, we take the data above and run the analysis.
BDI = (A/B)*100
CDI = (C/B)*100
BOI = BDI/CDI
This gives us the results below:
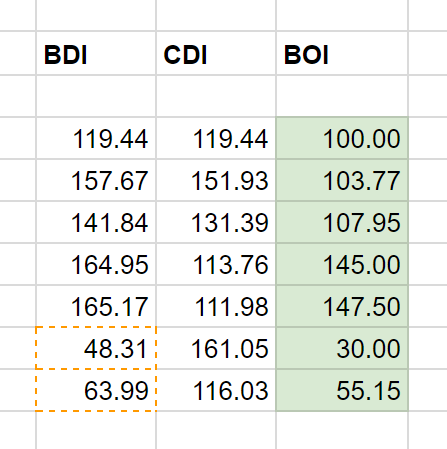
Results
With this in mind, looking at the BOI column, we can identify that most cities have a fairly even distribution; whereas Boulder and Seattle both are showing high CDI, but a low BDI identifying these as two opportunity cities.
As a result, we can break out the cities with a BOI less than 100 and distribute the Facebook Budget Allocation against these areas of opportunities.
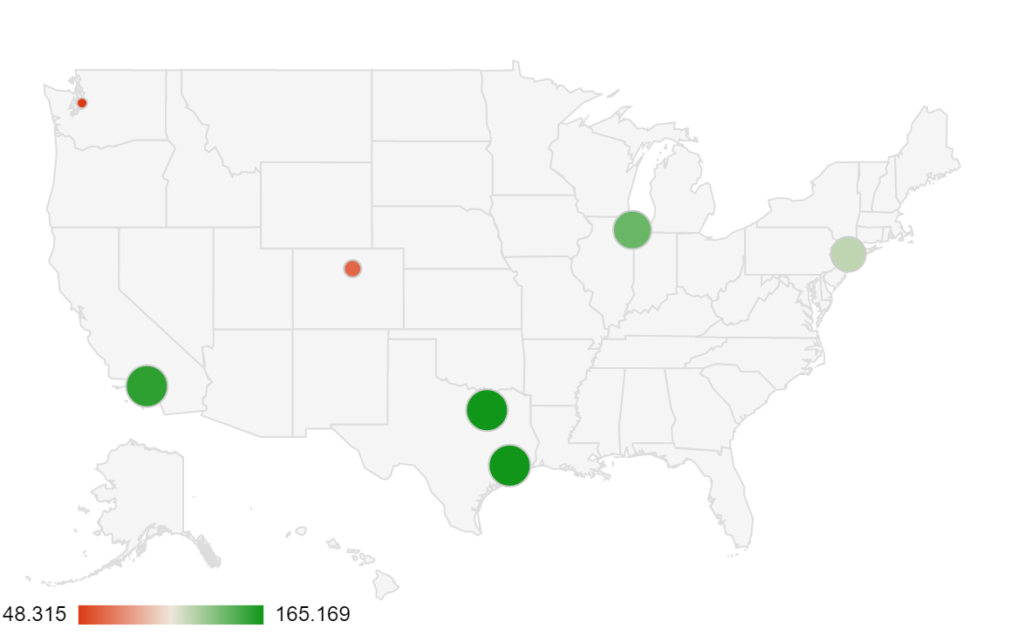
Visual Mapping
In this case, I only grabbed a sample size of cities, but when doing this analysis across many cities it is great to have a visual representation of this data for easier digestion and comprehension.
For this reason, I have found the below map graph to work best.
Your Thoughts
In conclusion, using a conventional approach to measuring the ‘digital brand index’ can provide a data-driven calculation to determining the most effective Facebook Budget Allocation.
Now it is your turn. Did you find this approach useful?
What methods have you used to identify the best distribution for your Facebook ad spend?
Leave a comment