How to Use Google Analytics to Increase E-commerce Conversions
Written by: Carl Torrence Read time 5 minutes
Google Analytics (GA) is one of the most important tools for Ecommerce businesses. This tool is integrated with more than 37.9 million websites and over 9 million websites use Google Analytics 4. It has the highest market share (29.62%) among all web analytics tools. The majority of users employ Google Analytics for marketing purposes.

Google Analytics basically gives you detailed insights about people coming to your website. It can tell you where they come from and what they do on your website. You can use these insights to define your strategy and drive marketing decisions. Let’s see how you can use this incredible tool to optimize conversions on your Ecommerce website.
Understand Google Analytics Reports
Google Analytics can deliver a variety of reports concerning traffic and user behavior. The platform offers six types of reports to track various user-related aspects of your website. You can access these reports from the tab on the left side of your screen.

GA reports help you collect vital information about your audience. The six basic types further branch into several different categories. Furthermore, GA has report templates specifically designed for e-commerce.
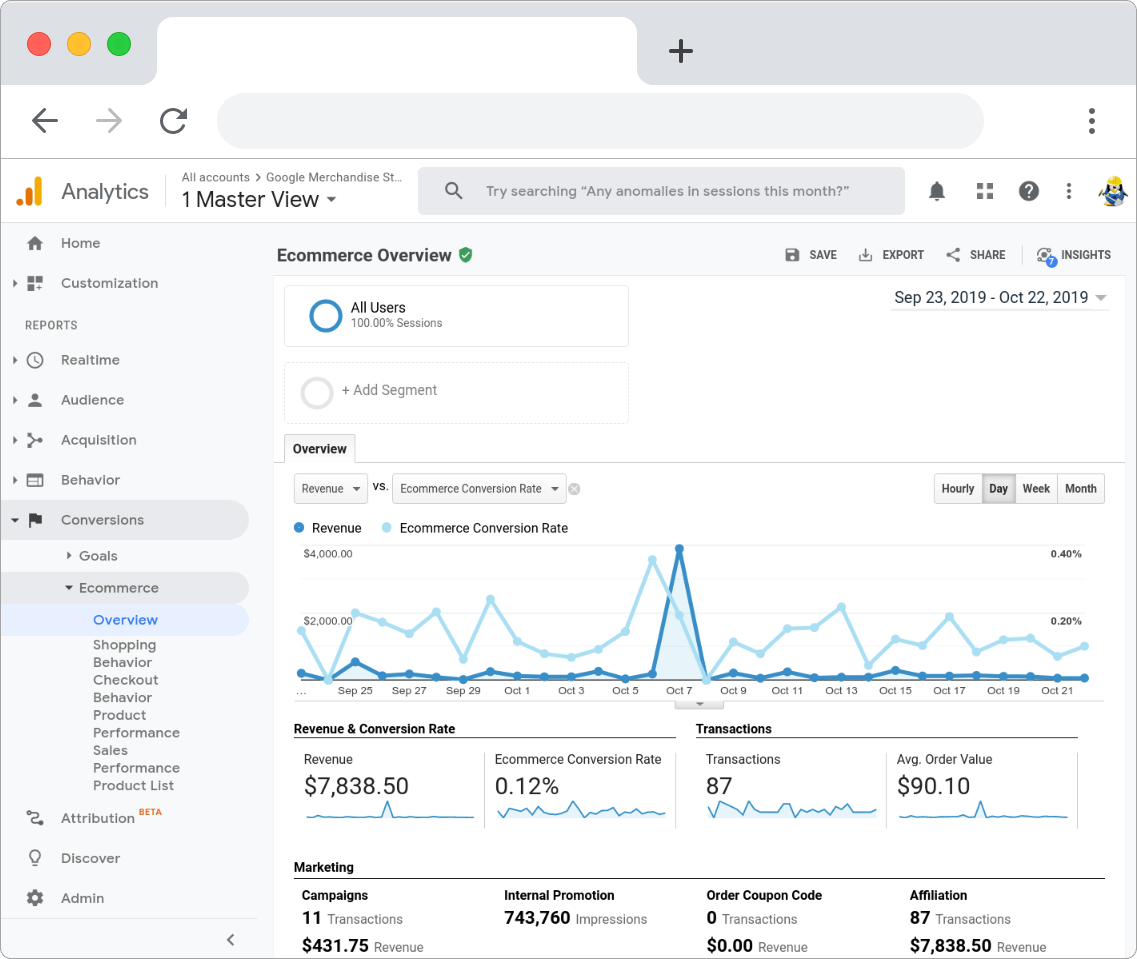
You can access this report once you complete the Ecommerce setup in GA. It gives you an overview of critical metrics such as conversion rate, revenue, active users, transactions, and so on. You can switch to Enhanced Ecommerce reports to gain more insights.
Use Enhanced Ecommerce Reports for Detailed Insights
This report gives you access to important data that plays a vital role in Ecommerce conversions. You can track the conversion rate and source of traffic for different products. The reports also show you purchase behavior-related metrics. You can see the products added to the cart and the ones removed from the cart.

This report also helps you pinpoint the exact stage of cart abandonment. Based on these insights you can work on features, products, offers, and services that can enhance conversion rates. You can also create different landing pages with unique attributes and measure their performance.
For instance, if you see high cart abandonment on the check-out page. You can address issues such as additional charges, payment options, fulfillment options, shipping time, account creation, and so on. These are some of the most common reasons for cart abandonment in Ecommerce.

These insights can also help you with different aspects of your overall Ecommerce strategy. Let’s say your customers are responding to self-fulfillment options. Then you can use a micro-fulfillment center close to the customer’s location to enable click-and-collect fulfillment service.
Once you understand the available features of GA reports, you can create custom reports for specific purposes. This brings us to conversion funnels.
Use Google Analytics to Track Ecommerce Conversion Funnels
A conversion funnel shows you the path that the audience takes when buying products on your Ecommerce website. This includes traffic sources, page visits, on-page engagement, and so on. The funnel is basically a breakdown of what people do when they come to your website.
You can use Google Analytics to track the traffic sources, webpages, and user actions that lead to most conversions. There are three ways to do this in GA.
1) Behavior Flow
The behavior flow report gives you an overview of all user journeys on the website. This report gives you a lot of information, such as:
- The pages that bring the most traffic
- The pages people visit after landing on your website
- The number of pages people visit before leaving the website
- The trail of web pages that lead to different actions
Behavior flow shows a step-by-step process of user interaction on your website.

Among these, you need to look for behavior flows that lead to your product pages and check-out pages. These paths are your conversion funnels.
2) Reverse Goal Path Report
This report gives you similar insights as the behavior flow report. But, it works in reverse. Hence, the name. Here you start with the end result. For tracking conversions, you should start with product pages, checkouts, or post-payment messages.

The reverse goal path report shows you the pages the customer visited before completing the goal. It also shows you the number of steps the customer takes before completing a purchase. This report helps you reverse engineer the conversion funnel. You can identify the pages, actions, and traffic sources that lead to conversions.
3) Goal Funnels
You need Data Studio to access this feature. It allows you to design a funnel based on goals. The goals can be a variety of use actions such as scrolling, button clicks, image view, and so on. You can create goal funnels for individual pages to identify the actions that lead to the most conversions.

This helps you understand user behavior on important pages such as the product page and check-out page. For example, your goal funnel set-up for the product page can include page visits, image/video views, scroll depth, clicks on customer reviews, CTA clicks, and so on.
You can align the goals into a step-by-step process to mimic the purchase journey. This helps you identify the elements that contribute the most to purchases. You can also find out the elements that are holding back your conversion rate.
Use Insights to Improve Conversions
You can use each of these funnels to optimize conversions on your Ecommerce website. The Behavior Flow and Reverse Goal Path funnels show you the purchase journeys that are already working. You can double down on these journeys to increase conversions.
Let’s say a user-guide blog post leads to significant conversions on the product page. Then you can advertise blog posts to bring more traffic. Consequently, you will get more conversions for the product. You can also create similar posts for other products to increase their conversion rates.
The insights from Google Analytics reports also help you identify problem areas. These are the pages, goals, and events that have a high drop-off rate. You can address these issues to streamline the customer journey towards purchase.
Suppose that Goal Funnel shows a significant drop in user engagement after 50% scroll depth. You can check the elements that are positioned in that area. Based on this insight you can either change, remove or replace these elements.
For example, if you have positioned the product description at 50% scroll depth. Then you need to identify the problem with this part. Perhaps the product descriptions are not appealing enough. Or it lacks adequate information. Or the audience would respond better to a video instead of text.
You need to understand the issue and make the necessary changes. Then once again you measure the impact of these modifications on the Goal Funnel and conversions.
Conclusion
Google Analytics can give you insights. A lot of insights. But, you need to know what insights to track and how to interpret them.
GA cannot directly increase Ecommerce conversions. But, it gives you the necessary data to make informed decisions. You can find out how people are interacting with your website. GA can tell you what is working and what is not. You can use these insights to create a smooth and flowing purchase journey that maximizes conversions from incoming traffic.
AUTHOR BIO:

Leave a comment