How To Create Behavior Flows [Using Goal Funnels in Data Studio]
In this post I will take a look at analyzing soft conversions using Goal Funnels in Data Studio.
In a previous post Often Overlooked [but important] Event Goals in Google Analytics, I covered setting up and tracking event goals in Google Analytics.
So let’s explore how tracking soft conversion can help you understand a user’s journey on your site.
First off What are Soft Conversions?
Soft conversions are actions that indicate the steps a user takes as they move closer towards a final conversion.

As an illustration, the analog parallel could be that of a shopper in a store:
- First, they browse different aisles (categories).
- Then the shopper focuses on the aisle containing the products they want.
- Next, they compare the various products and maybe put two or three into their cart.
- Then they head towards the register and make a purchase.
Now in the real, it is not as simple and straightforward to measure customer behavior.
Especially at scale.
But in the digital world capturing each action that indicates interest or progress down the conversion funnel can be easily tracked.
Therefore the ability to capture all interactions gives us a wealth of insights we can use to optimize our initiatives.
Defining Our Goal Funnels
Ok, first we will need to identify the Google Analytic goals that will make up the steps of our Goal Funnels in Data Studio.
In the event that we do not have existing data to work with, we can create a hypothesis of what set of actions a user will take as they move closer to the final conversion.
Note: Remember that goals can only capture data moving forward and does not retroactively backfill goal values.
Primary Goal:
For this example, we will use a primary goal of driving leads.
Soft Conversions:
The non-explicit interactions that we will measure leading up to the final conversion will be:
Scroll Depth
Learn More
Primary CTA
Lead (conversion)
We will be analyzing these funnels from two perspectives:
- All traffic user behavior through the funnel flow
- Channel user behavior through the funnel flow
Note: This approach is assuming that the funnel starts on a specified landing page.
Creating Goal Funnels in Data Studio
Google Analytics does allow visualizations of funnel steps based on page path (or event goals if you are firing virtual pageviews as a workaround).
However, I like to create simple Goal Funnels in Data Studio to create a visual and simple to read behavior flow for analysis.
Let’s Head over to Data Studio
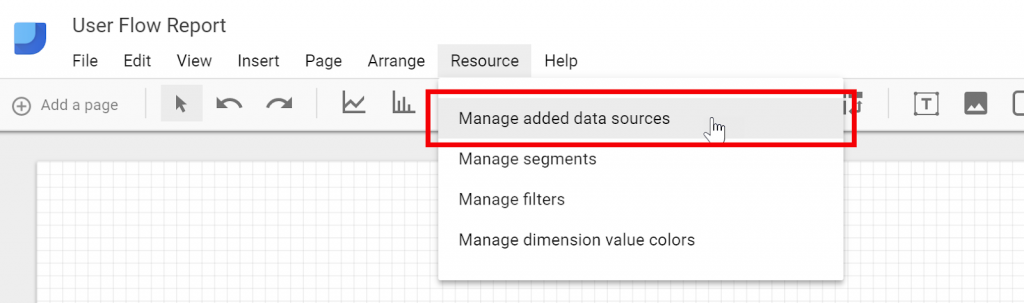
Under Resource in the top menu got to Manage added data sources and click Edit
The first thing I want to do is rename my Goal Completions so that they are easier to read.
Click on Goal X (Goal X Completions) and give it its respective name. Here I will label Goal 7 as Scroll.

Rename every goal that you will be using when creating a funnel in data studio.
Next, we want to define the steps themselves as conversion rates respective to the previous goal.
We cannot use a specific goal conversion rate since Google Analytics calculates these as ‘Goal divided by Sessions’.
To do this let’s create a Custom Field for each step.
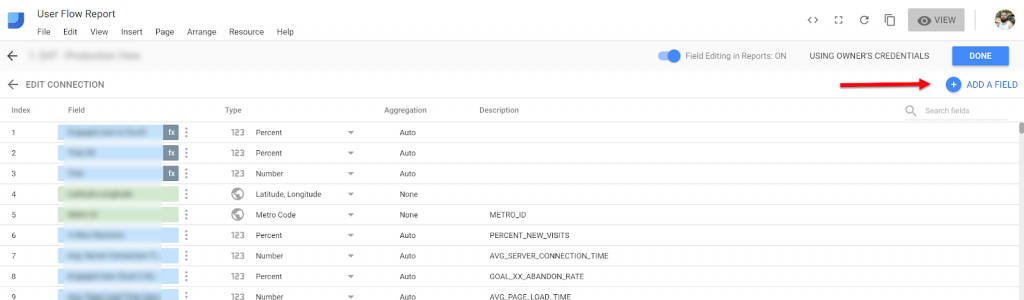
Under Data Source click Edit.

Then click +Add Field.
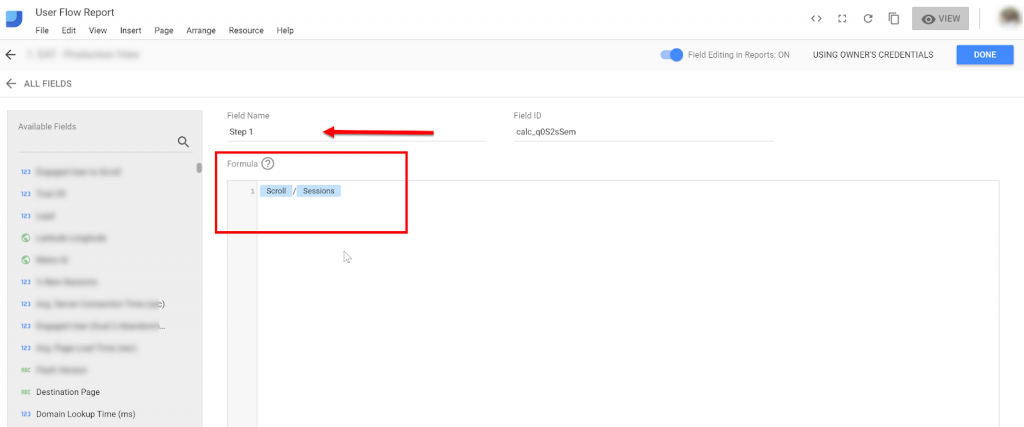
The First Step in the funnel will be capturing users that consumed the content. (Engaged Users)
In this case, I am defining engaged users by anyone that has scrolled at least through 50% of the landing page.
I am going to call the new field Step 1 you can also call it Step 1 (Scroll), and the formula will be Scroll / Sessions.
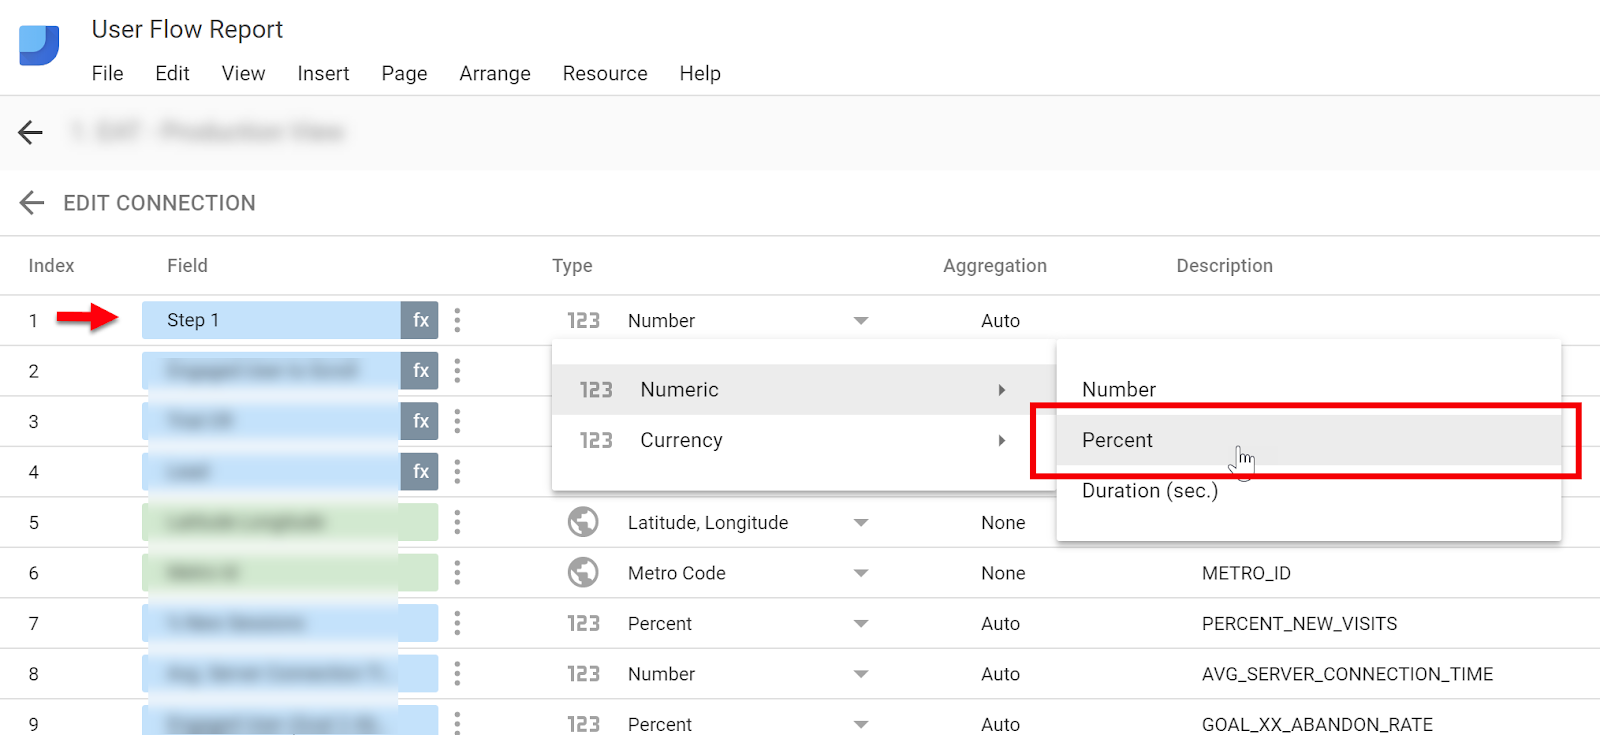
Since this metric reflects conversion rate in data studio hit Save and make sure to change the Data Type to Percent.
Defining All Steps for our Goal Funnels in Data Studio
We are going to take the same approach to create one formula for each step in the funnel.
Start = Sessions
Step 1 = Scroll/Sessions
Step 2 = Learn More/Scroll
Step 3 = Primary CTA/Learn More
Step 4 = Lead/Primary CTA
After all steps are defined, we are ready to start graphing our Goal Funnels in Data Studio.
Note: If your funnel consists of pages, not goals and you do not want to use all of your available goals (there are 20 for each view) in Google Analytics you can use Matthew Brandt’s approach of leveraging Sessions ID’s in a CASE statement.
Graphing Each Goal Funnel Step
Now that we have the metrics needed let’s go ahead and chart the Google Data Studio behavior flow funnel.
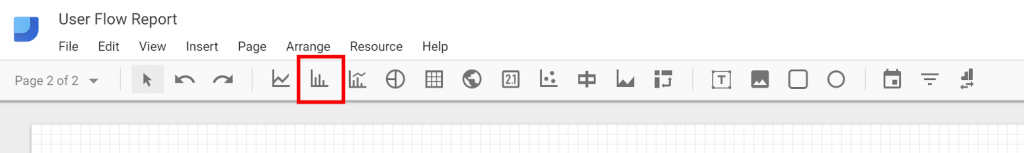
Click the bar chart icon.
Change the Dimension to Landing Page
Under Metrics pull in all your Custom Fields created above. One for each step.
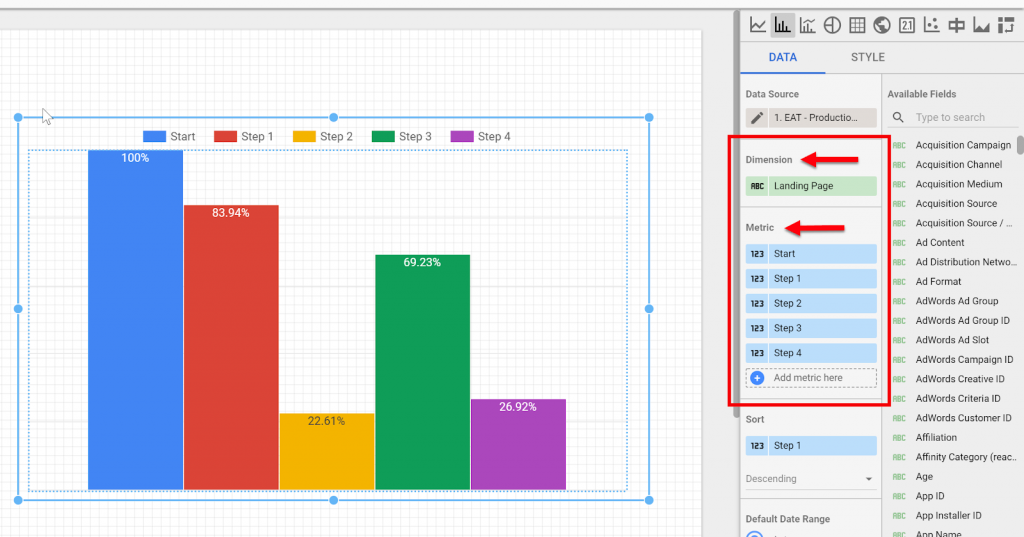
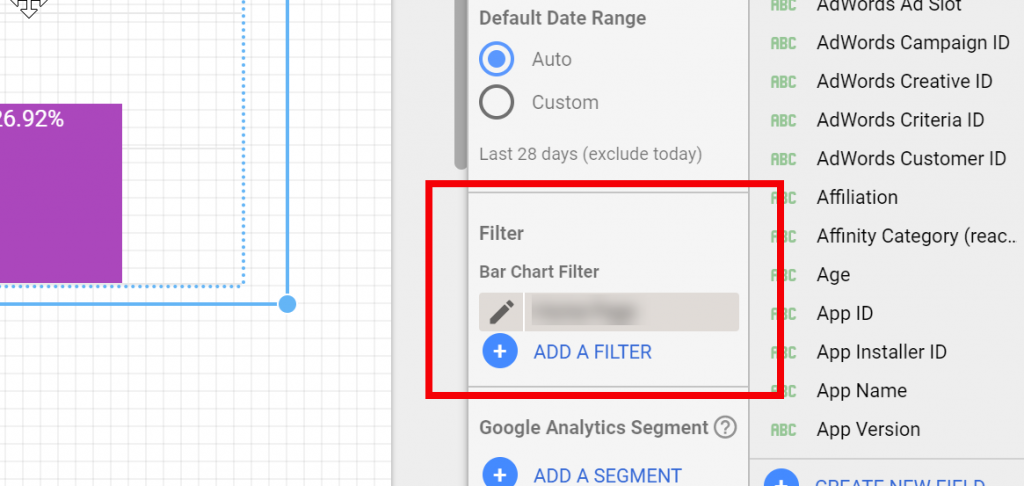
Note: Make sure to set the appropriate filters.
In this case, I want to see traffic coming into the defined landing page only.
As a result, looking at the data this way gives us a straightforward funnel visualization of a users path to conversion.
Analyzing Steps by Landing Page
By examining the overall landing page performance, we can see that users are moving down the funnel as intended with positive conversion rate.
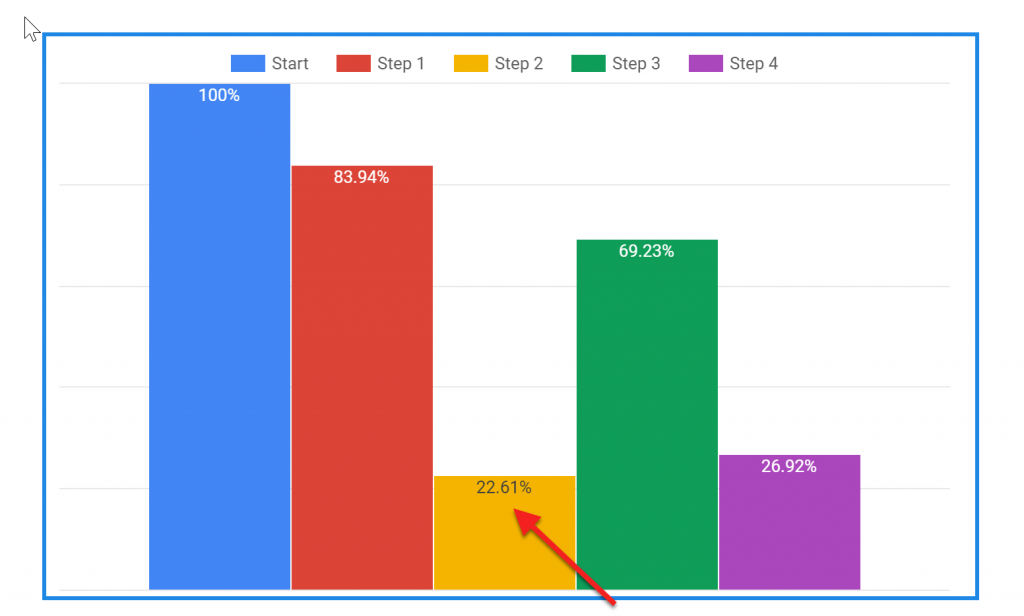
However, I am noticing that many users are not exploring the Learn More (not a required step) in the third step of the funnel.
The low Learn More conversion rate can imply that:
- This step is unnecessary
- This step is not definite and missed
To improve our user flow and potentially increase conversions:
- Make the Learn More more prominent
- Remove friction by eliminating the Learn More altogether
Analyzing Steps by Source
Taking another approach, we can look at the funnel by the source to identify what channels are driving final conversions.
Note: Keep in mind that we are using Google Analytics cookie-based data for analysis. Referencing the events report in Facebook Analytics can provide additional insights.
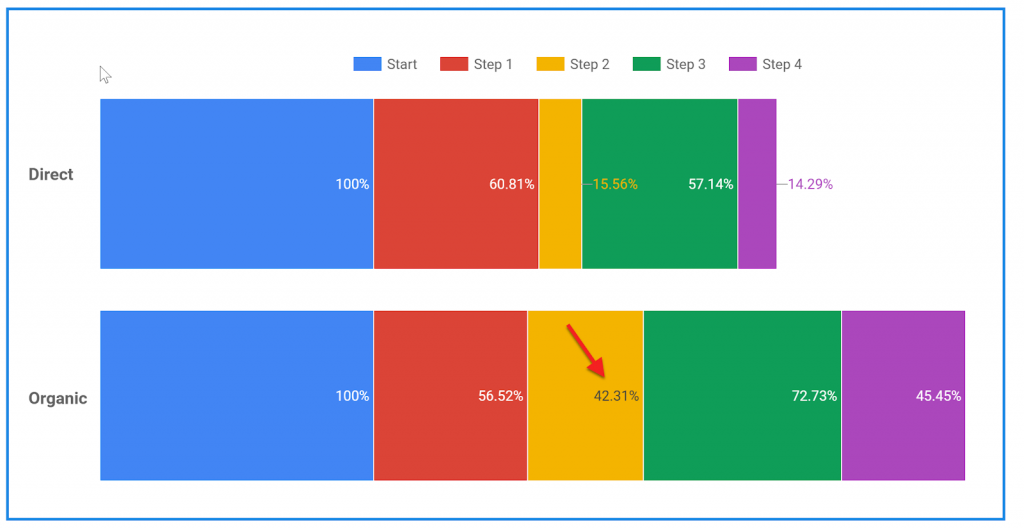
For example, this view can be helpful to identify channels that are producing the most effective path to conversion.
Also, we can understand how well the behavior flow works for users from various sources especially when trying to understand the effectiveness of specific campaigns.
As we can see in the above chart, Learn More plays a much more critical role in Organic traffic as opposed to Direct Traffic.
Conclusion
To summarize capturing soft conversions can provide valuable insights into how effectively you are driving users from consideration through to conversion.
While the use case provided here is specific to lead generation, it can be applied to e-commerce scenarios as well.
So how have you leveraged goals and Goal Funnels in Data Studio to understand the user journey better?
Thanks for the post. It’s clear, concise, and helpful.
Thanks for the information, this will help a lot with setting up goal funnels for our clients in ecommerce. A bit of a tedious process, but it will hopefully be useful. Cheers!
Glad to hear you found this post helpful 😃