How To Use Facebook Analytics – Three [Easy] Reports To Get Started
Note: As of July 1, 2021 the standalone Facebook Analytics tool is no longer available. According to Facebook this is part of an initiative to consolidate business tools. You can learn more about Facebook changes related to iOS14 Privacy updates here.For better Facebook Ads reporting read our blog on how to create Facebook Ads Dashboards in Google Analytics.
What Is Facebook Analytics?
Facebook Analytics is a powerful way to report on events and audiences across devices leveraging Facebook’s people based tracking capabilities.
In addition, Analytics for Facebook is free, and you can easily access it directly from your Ads Manager.
To clarify, Facebook Analytics is not a replacement for Google Analytics. However, leveraging key features provides a deeper omnichannel understanding of performance.
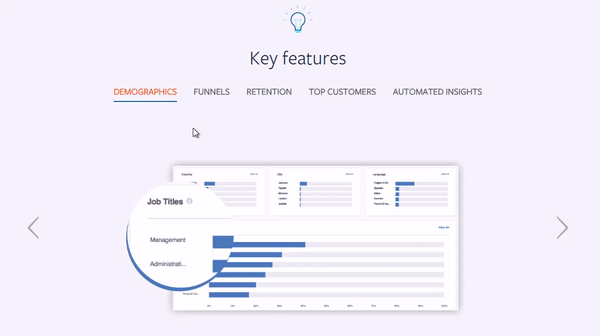
The key features consist of:
Demographic
Funnel
Retention
Top Customers
Automated Insights
Why Use Facebook Analytics?
The value of analyzing site wide data using Facebook, as opposed to Google Analytics, is that Facebook with its 2 billion users can track people across devices and multiple channels (online and offline). As a result, you can get accurate omnichannel user insights.
Google Analytics, however, tracks users through a cookie with the primary limitation being that you cannot identify users across devices.
Note: You can read more about how each platform tracks events and conversions respectively in Facebook Pixel vs. Google Analytics Conversions
Ok, you could say why open up another tool and another dashboard in the already fragmented landscape.
Although this may be true, there are some simple, actionable insights you can extract.
As a result, I created this simple Facebook Analytics tutorial.
Below we will explore the Automated Insights, Funnels and Overlap Report specific to digital initiatives.
How To Use Facebook Analytics
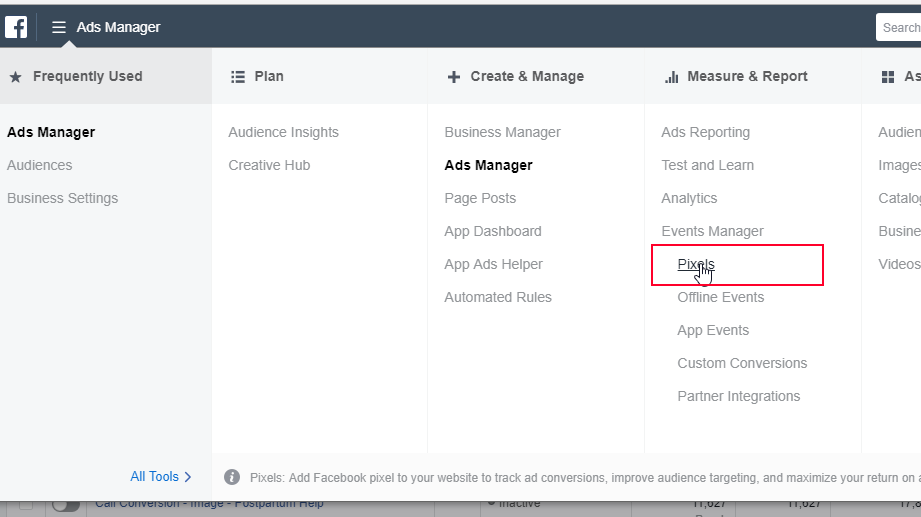
First, to access Facebook Analytics, you can go directly to Analytics in the Facebook Ads Manager.
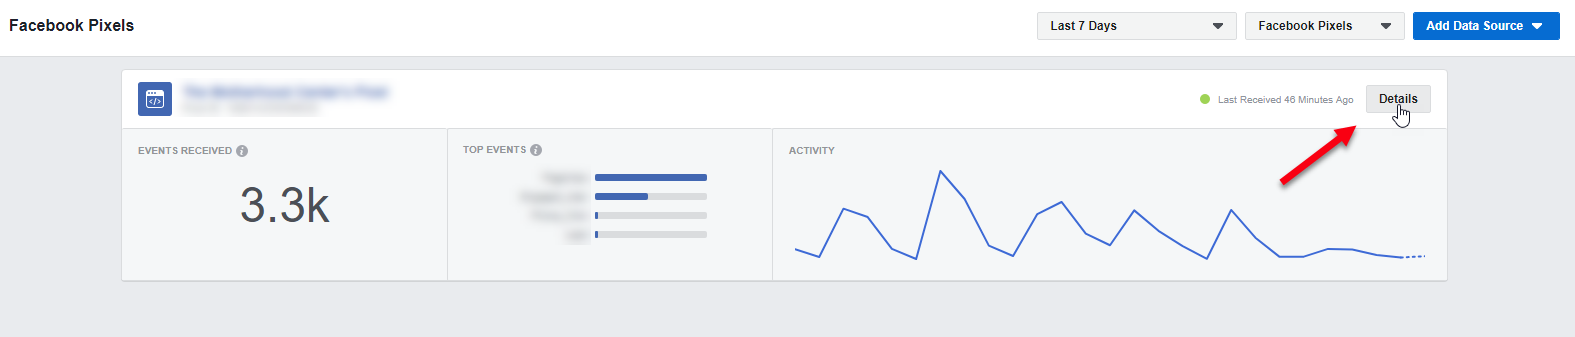
Next, Click Details
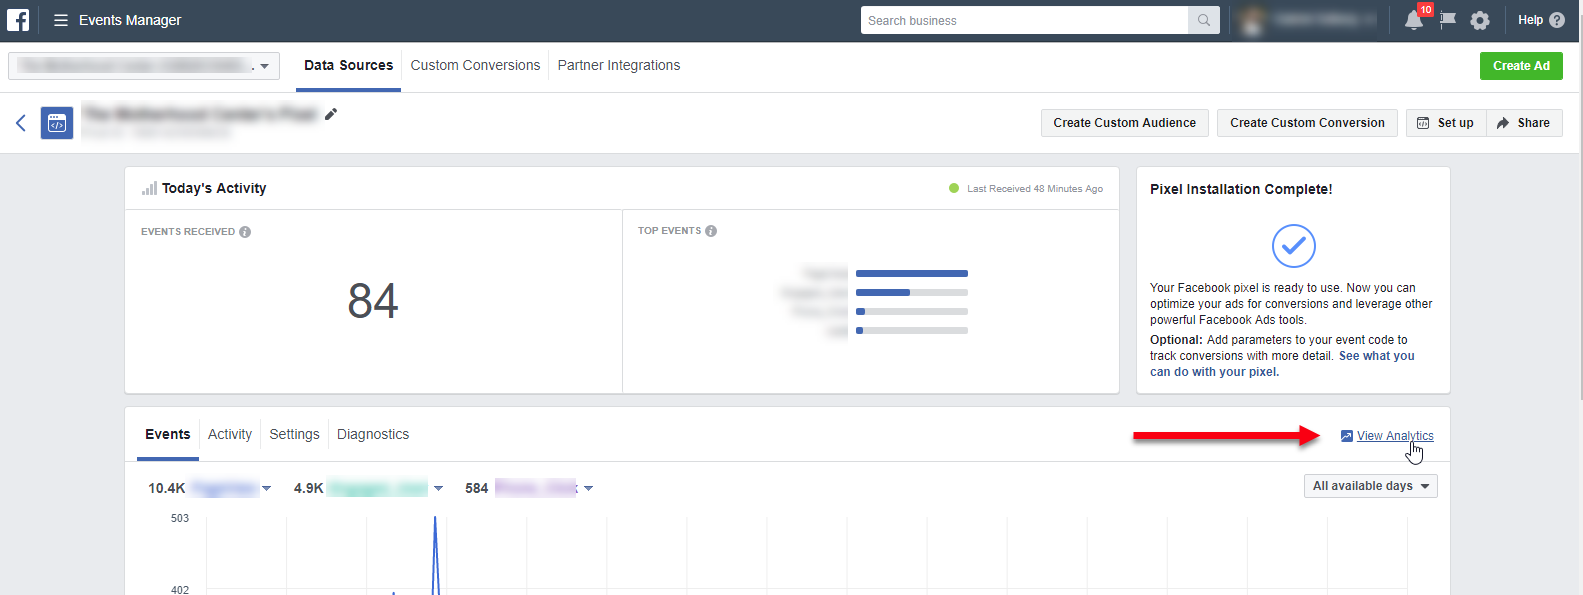
Then select View Facebook Analytics
The main navigation is on the left; you can see an overview dashboard, which can be customized, highlighting key insights.
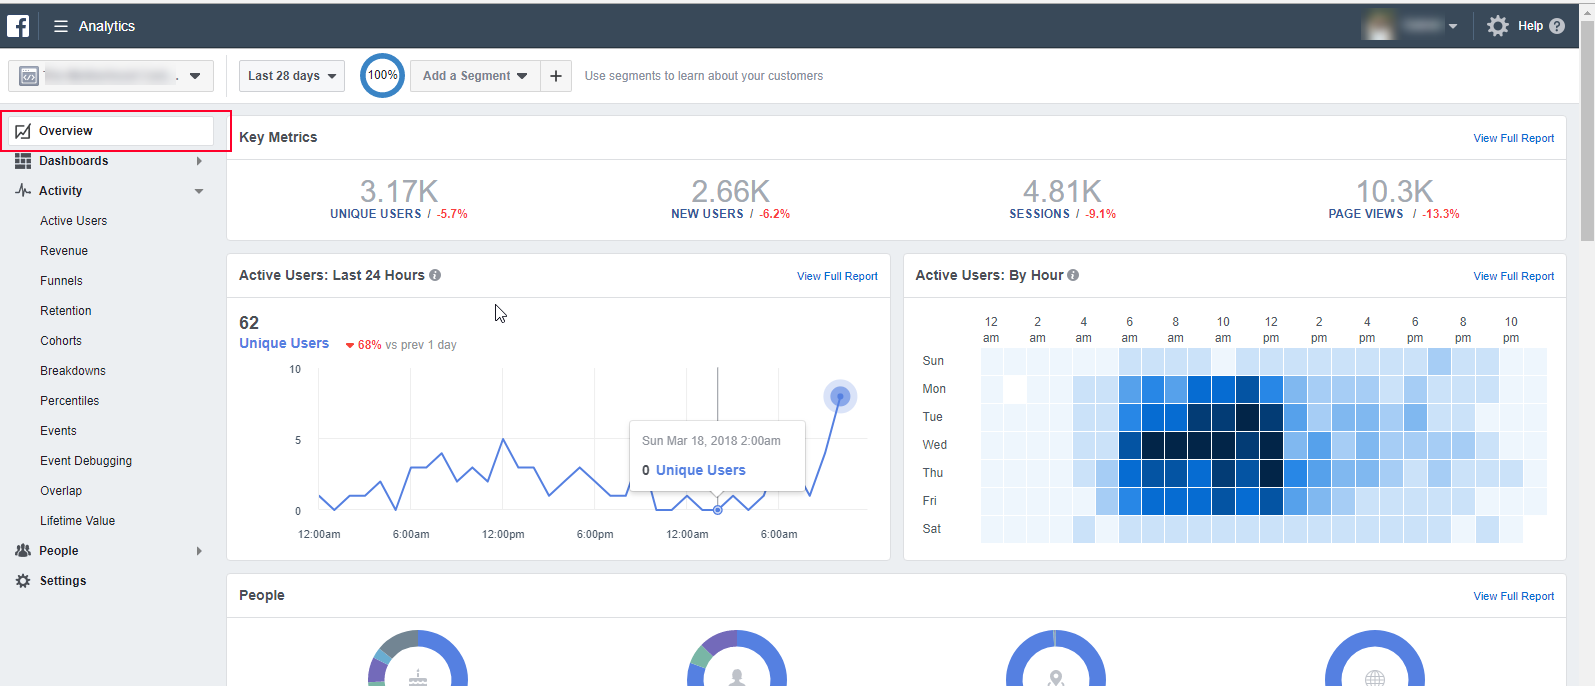
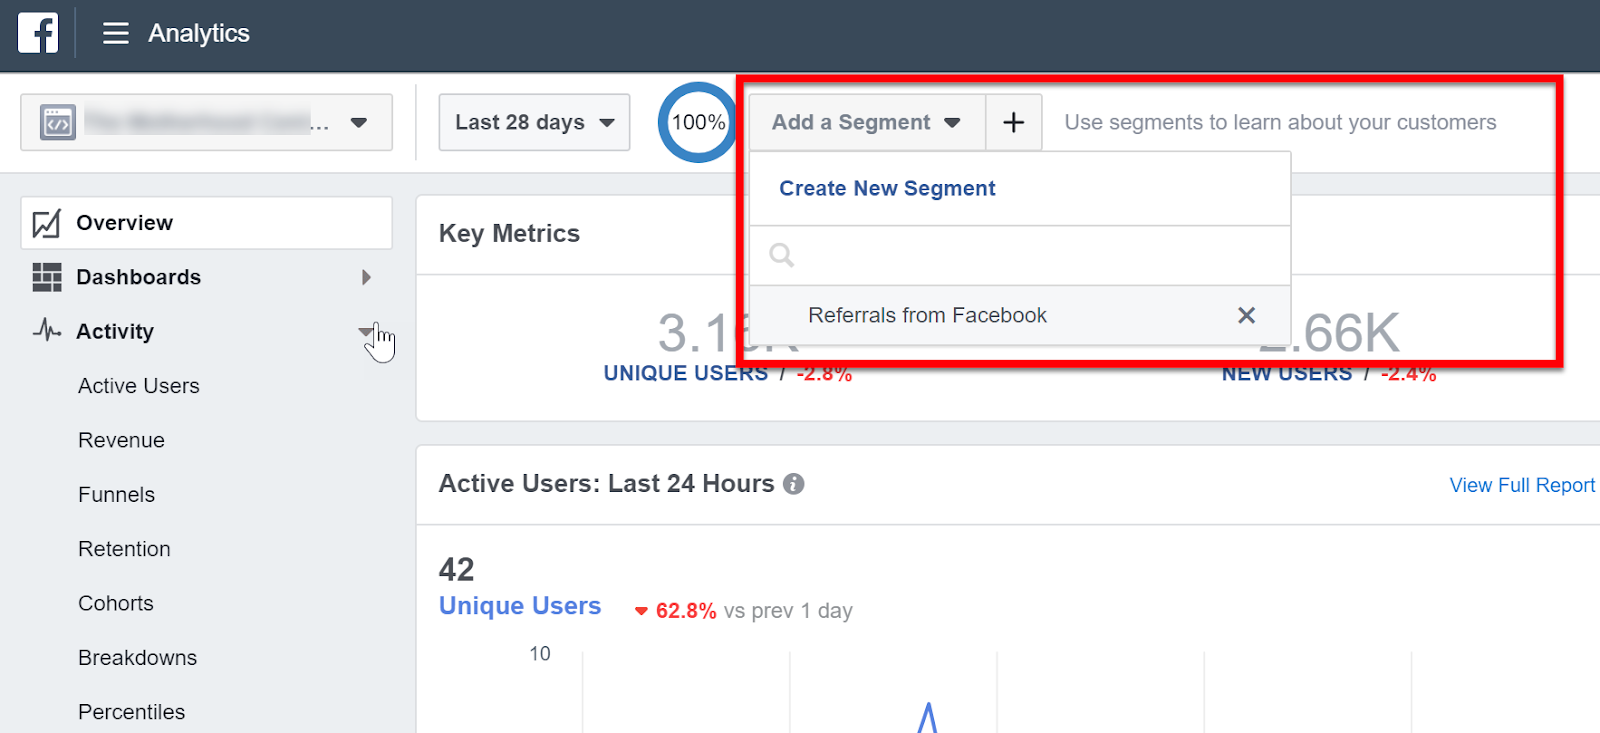
Similarly to Google Analytics, you can modify/define the date range and create or define segments to use across all Facebook Analytics reports.
Facebook Analytics Insights Report
Facebook uses machine learning and artificial intelligence to generate valuable insights into performance.
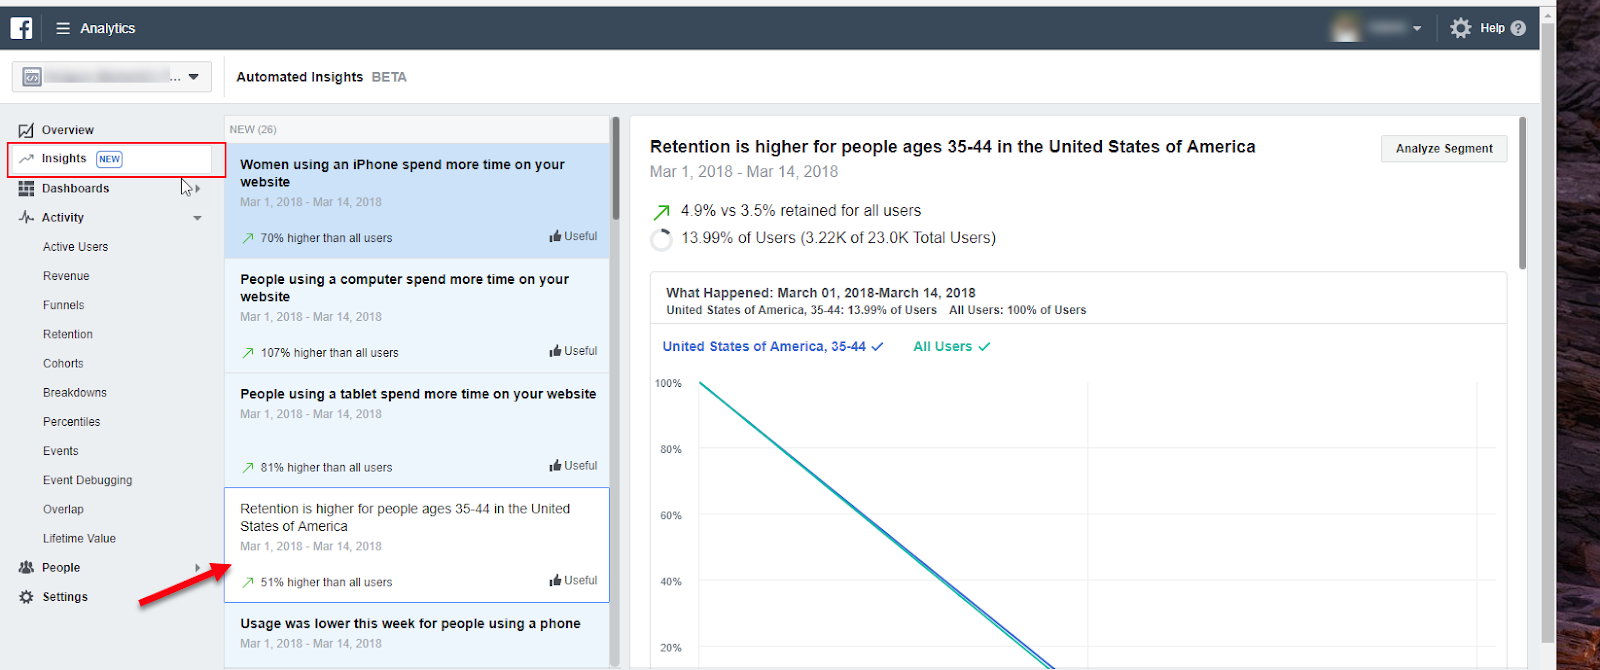
When we navigate to the insights tab on the left you get a list of insights such as demographics, device, and retention.
This is a great way to get a quick view of how your target audiences are performing.
For example, the insight below is saying that people 35 – 44 are showing the highest retention but that these only make up 13.99% of all users.
Here is an opportunity to revisit our audiences and potentially expand into new or fine-tune existing targets.
Leveraging Funnel Reports
You can quickly build custom funnels off of events on your website.
This helps you understand the effectiveness of users on-site experience.
Given that funnels are built off of events make sure to capture as many soft and hard KPIs as you can that are critical to understanding a users journey.
Unlike Google Analytics where you can only create funnels off of page destinations (or events firing as virtual pageviews), you can mix and match events in any order to create custom funnels and quickly see valuable insights.
How to Read the Funnel Report
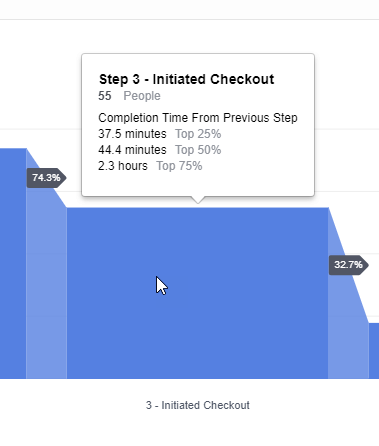
Here is a custom e-commerce funnel from engaged users through to purchase.
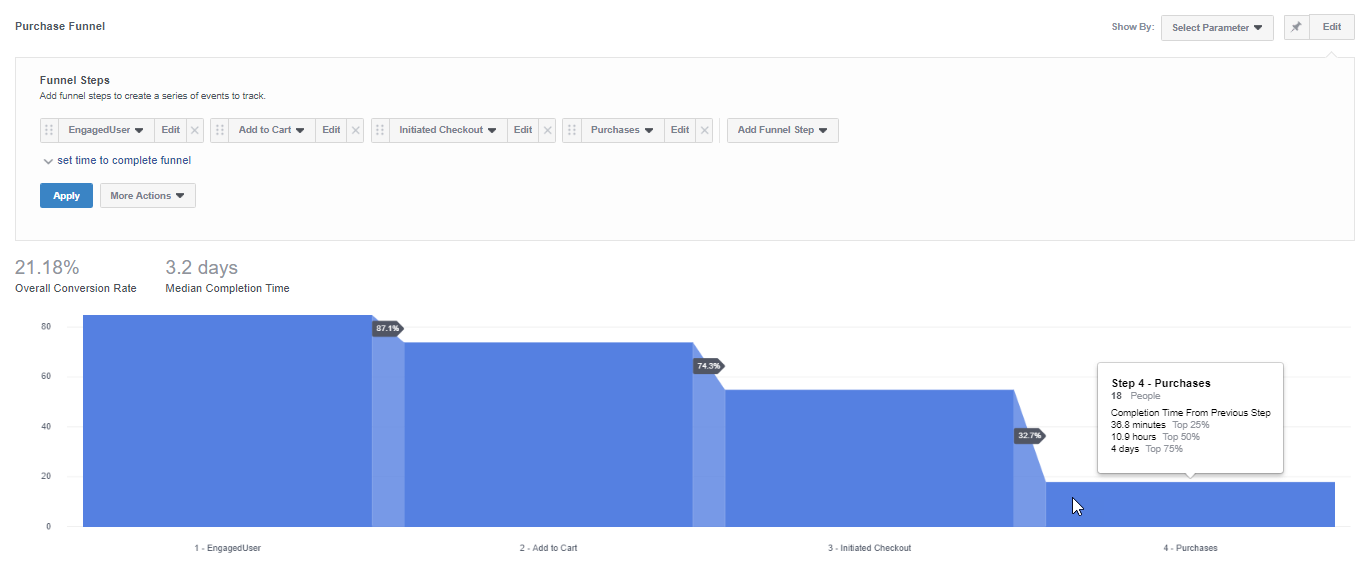
The funnel provides a simple overview of how users are working their way through the steps in their path to purchase.
If you hover over each step, you can get further insights.
For instance, we can see that the top 50% of users took 44.4 minutes to initiate a checkout with the top 75% taking over two hours.
As a result, the extended time to initiate a check out can be attributed to either a high-value product with a more prolonged consideration period before commitment or a very confusing site.
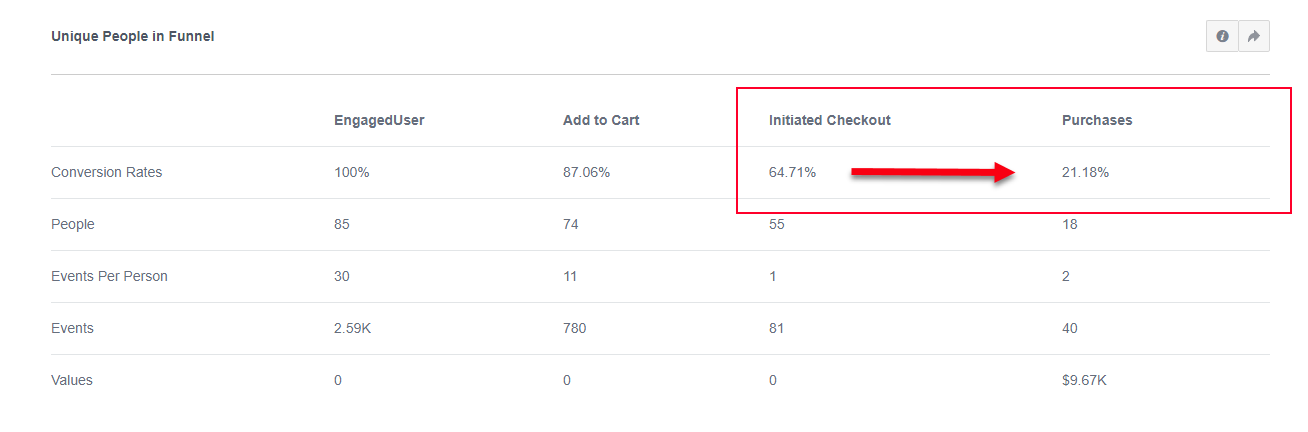
If we scroll a little further down and look at the ‘Unique People in Funnel Table’ we can see that there is a significant drop off from initiate checkout to purchase indicating that the checkout process needs improvement.
Moving on to the next table ‘Completion Time for Each Step’ we look at the time it takes to complete the funnel we are again noticing a hang up from in the check out process.
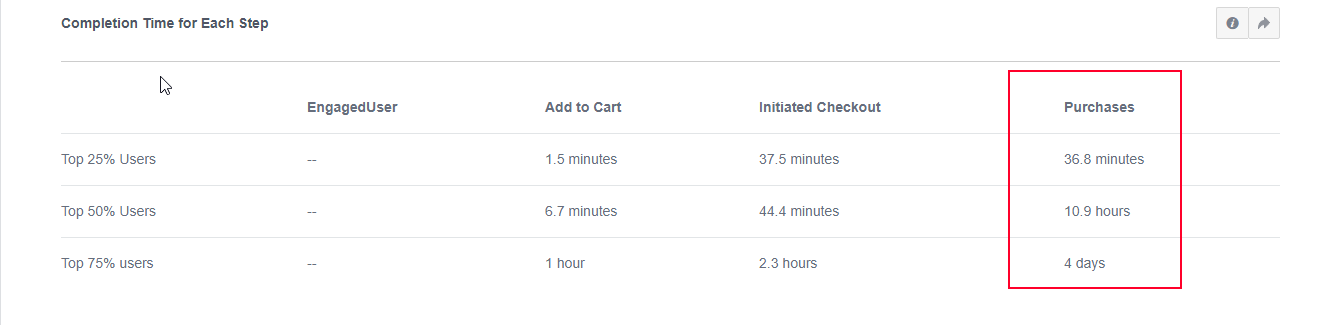
Building funnel off of soft and hard events is a great way to gather insight into on-site user behavior.
Getting Insights From The Overlap Report
One valuable attribution metric I want to extract from the Facebook pixel that I cannot grab in Google Analytics is user behavior across devices and channels without the cookie limitation.
Therefore, to get a better understanding of cross-device and cross-channel behavior, I reference the overlap report.
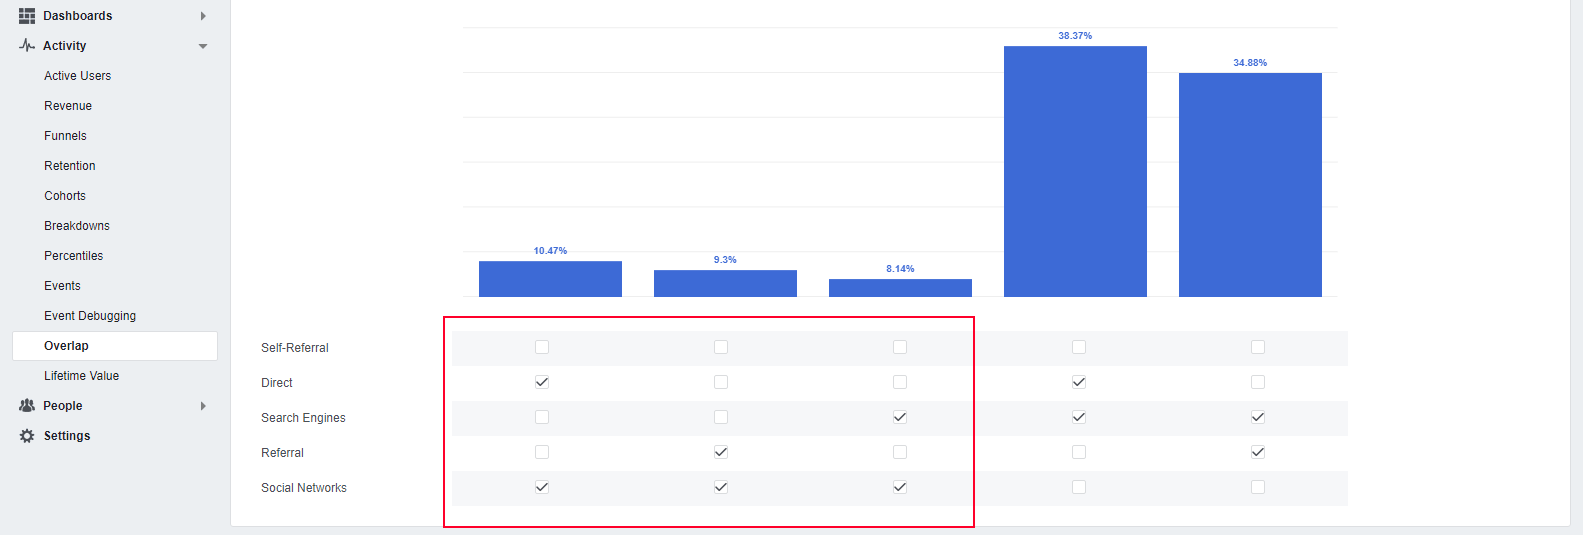
In the screenshot above I am only looking at the overlap of two channels with Social being the baseline channel.
As a result, you can see Social and Direct have the highest overlap followed by social and referral channels.
What can we do with this information?
Now that I see a high overlap between social and direct I can look at Google Analytics top conversion path report and look for a similar pattern.
The above is not a one to one comparison.
There will always be differences given how Facebook captures some of this data compared to Google Analytics.
However, these are great directional insights that help me understand the indirect or assisted value across channels.
Social & Referral Traffic
For example, if you were seeing a large number of converting users coming from an overlap of social and referral you could dig into the referral traffic in Google Analytics and potentially uncover third party sites/publishers for potential partnerships/initiatives.
Social & Search Traffic
Or if you are seeing a specific segment of users that have a substantial overlap with social and search.
As a next step, you could indirectly maximize the social exposure against these users and follow up with a more aggressive search campaign.
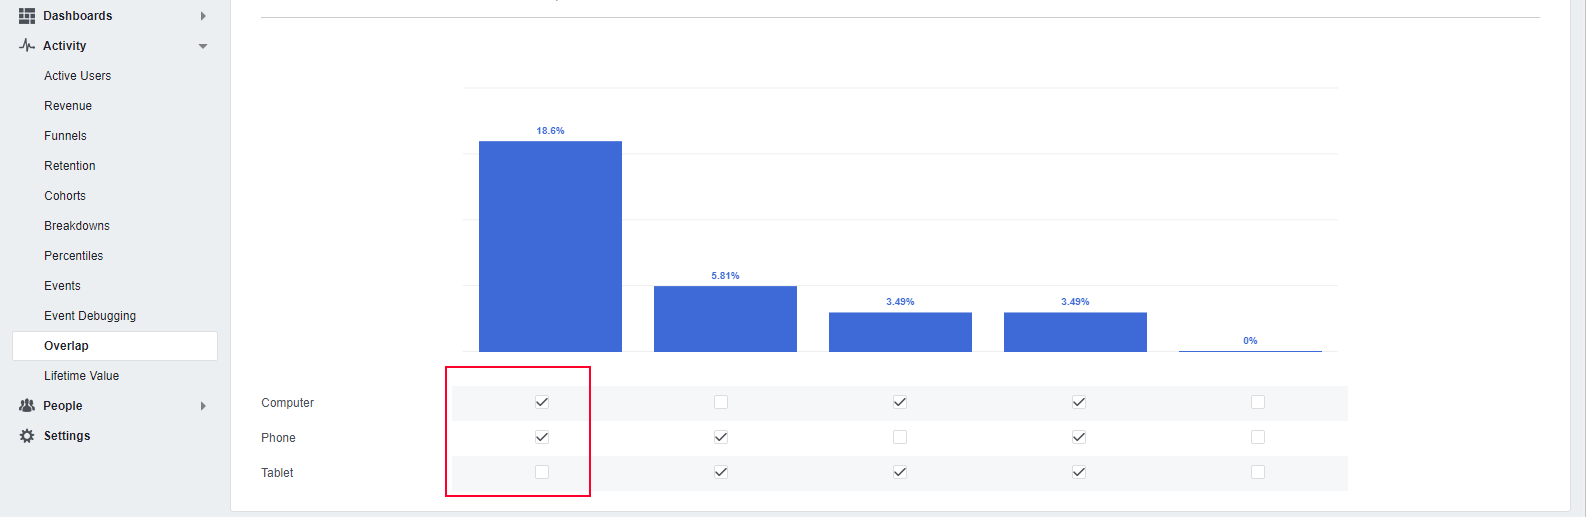
Device Overlap
What about device overlap?
Facebook Analytics allows you to see overlap across devices.
It is not surprising that there is considerable overlap between phones and desktop followed by phones and tablets.
Conclusion
I have just scratched the surface of what is possible to achieve with Facebook Analytics.
If you want to learn more check out these 8 Smart Facebook Insights Reports from Mobile Monkey.
Yes, Facebook Analytics opens up another dashboard and yet again another isolated data source.
However, given that Facebook captures all site visitor data, regardless of where they come from, we can extract valuable and actionable Omnichannel insights.
Although these insights are at times directional, that we can still effectively leverage Facebook Analytics to test and optimize campaigns.
What have you been able to uncover using Facebook Analytics?
Leave a comment