5 [Underused] Google Analytics Features
Google Analytics is a powerhouse tracking and reporting tool and along with it comes a comprehensive suite of Google Analytics Features.
It is only natural that some features will be missed.
But as a digital marketer, I am always exploring and pushing the boundaries of the tools in use.
Here I have compiled a simple list of some less known (in my opinion underused) Google Analytics Features.
Let’s take a look at what these are.
Google Analytics Features #1 – Calculated Metrics
Calculated metrics are a great way to look at data not available via standard metrics.
I have found calculated metrics especially useful with Goals and imported Third-Party campaign data (cost impression and click metrics).
As long as I have all my data housed in Google Analytics I can go ahead and create custom calculated metrics to get a better understanding of campaign performance.
For example:
CPV (Cost Per Visitor) = Cost / Sessions or Cost / User
Given that there often is a data translation loss from click to the sessions I like to create the CPV calculated metric to monitor my cost per tracked user/visitor.
In a sense, it creates accountability by not solely relying on the ad platforms click data.
CP Conversions (Lead or Event Goals) = Cost / Goal
Creating the CPA calculated metric gives me the ability not only to look at goal conversion rate but also understand efficiency in custom reports.
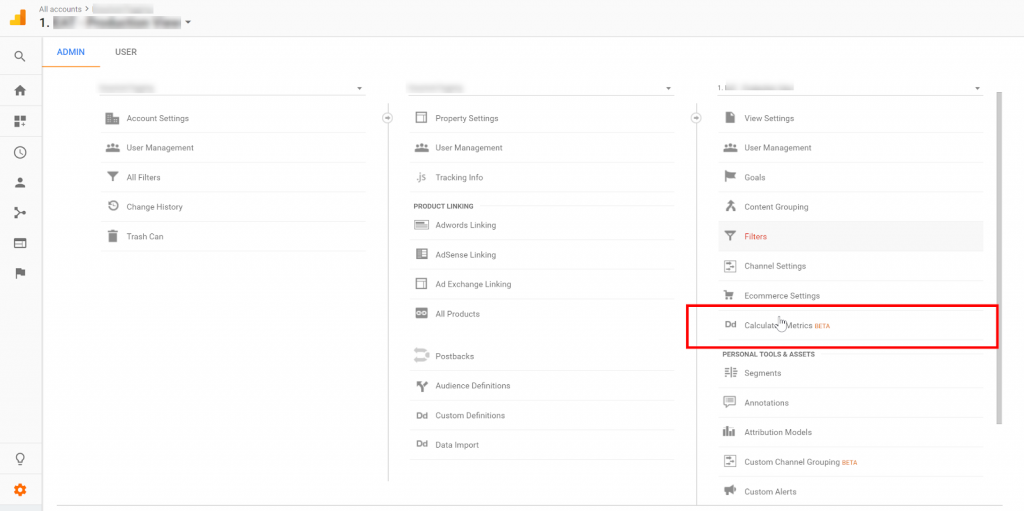
To access calculated metrics go to View Column in the Admin section:
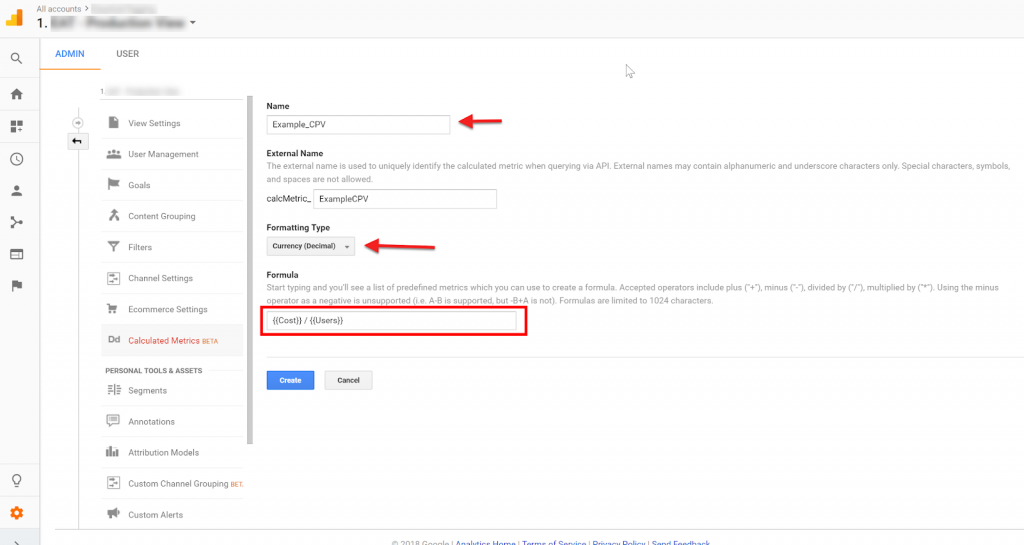
You can create your Calculated Metric using any combination of metrics.
- Give the Calculated Metric a name
- Define the Formatting Type, in this case, I will use Currency (Decimal)
- Enter your formula. For CPV I am using cost / user
- Save your Calculated Metric
You can now access your Calculated Metric in custom reports and dashboards.
Note: Use calculated metrics wisely since you are limited to five Calculated Metrics for each view in the free version of Google Analytics.
Google Analytics Features #2 – Custom Alerts
Anomalies in data tell us something is, well…changing.
But change is not always adverse it can be a good thing.
Either way we as marketers need to monitor and identify anomalies quickly so that we can take the necessary actions to ensure positive campaign performance.
Identifying all of these changes can be a daunting task when working across large accounts and many campaigns.
To make monitoring campaign performance more manageable, I leverage custom alerts so that I get notified when things are not going my way.
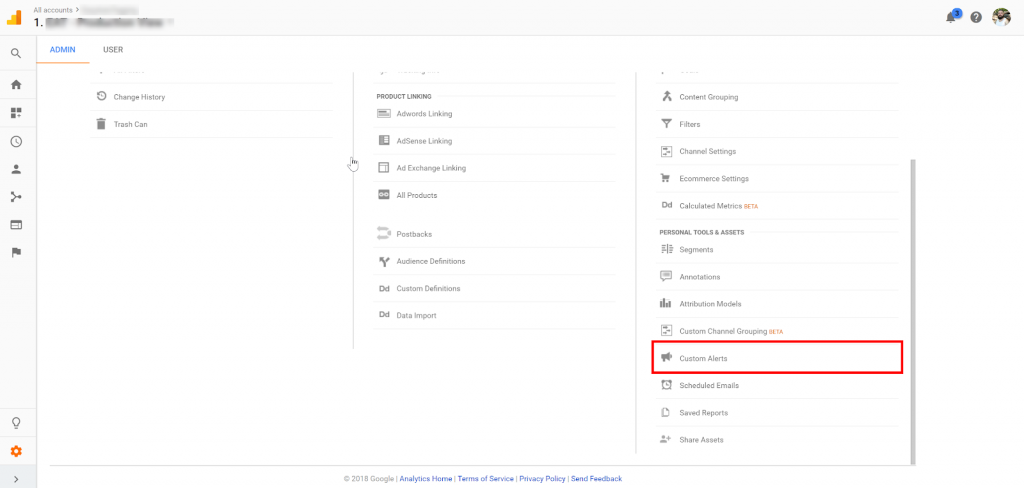
You can access Custom Alerts under the View Column in the Admin section:
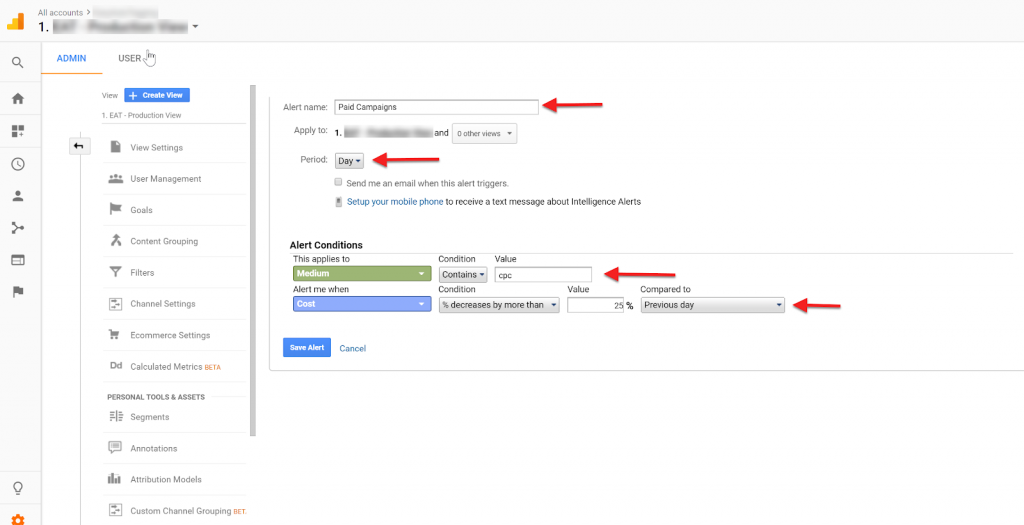
To set up your alert:
- Click create new and give it a name
- Define the alert period as day, week or month
- Set the filter conditions specific to your needs
- Optional – you can choose to get text notifications and / or add e-mail address
- Define the metric change you want to monitor. In this case, I want to know if the cost dropped by more than 25% compared to the previous day.
- Save the alert
Google Analytics Features #3 – Custom Reports
The standard reports in Google Analytics provide a wealth of insights, and I can take this even further by pulling in secondary dimensions.
But standard Google Analytics reports only go so far.
So when I want to see a breakdown of information specific to my needs (including calculated metrics) I leverage custom reports.
These are easily accessible and can also be scheduled as e-mail updates on a weekly or monthly basis.
Once you have created and saved your custom report you can ‘Save’ it in the top right corner.
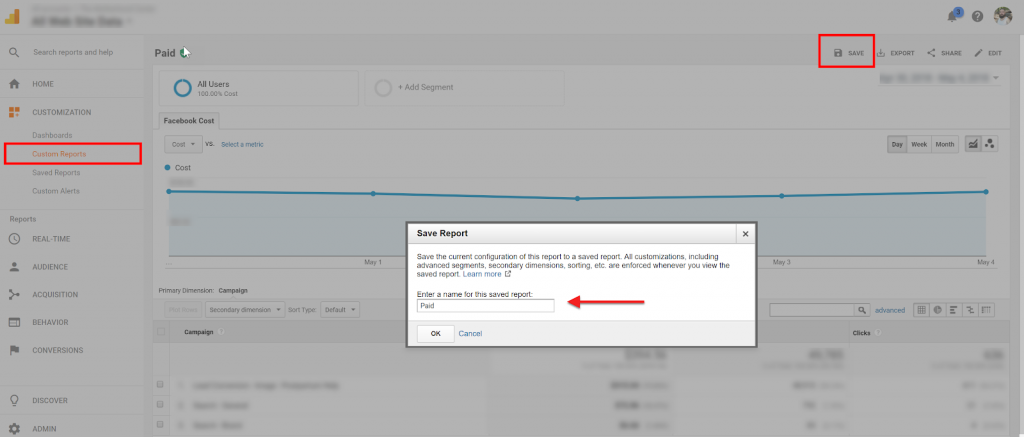
This makes the report accessible under Saved Reports and you can then:
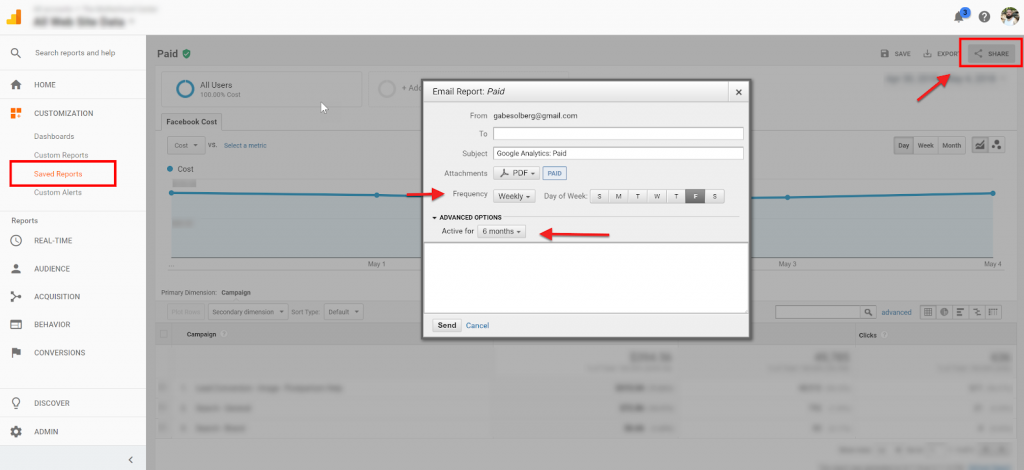
- Click share in the top right corner
- Add recipient emails to receive the report
- Set the report frequency and delivery day
- Define the Active length for this report
- When you are all done click send, and you should be all set
Google Analytics Features #4 – Top Conversion Paths
Top Conversion Paths is less of a Google Analytics Features but one of my favorite attribution reports.
This report can give me an excellent understanding of campaign, audience or creative performance across channels.
I reference this report as directional insights into how users are converting across channels.
I can then optimize specific channels by allocating budget and/or aligning creative and messaging with the most likely touch point the user will be on in the path to conversion.
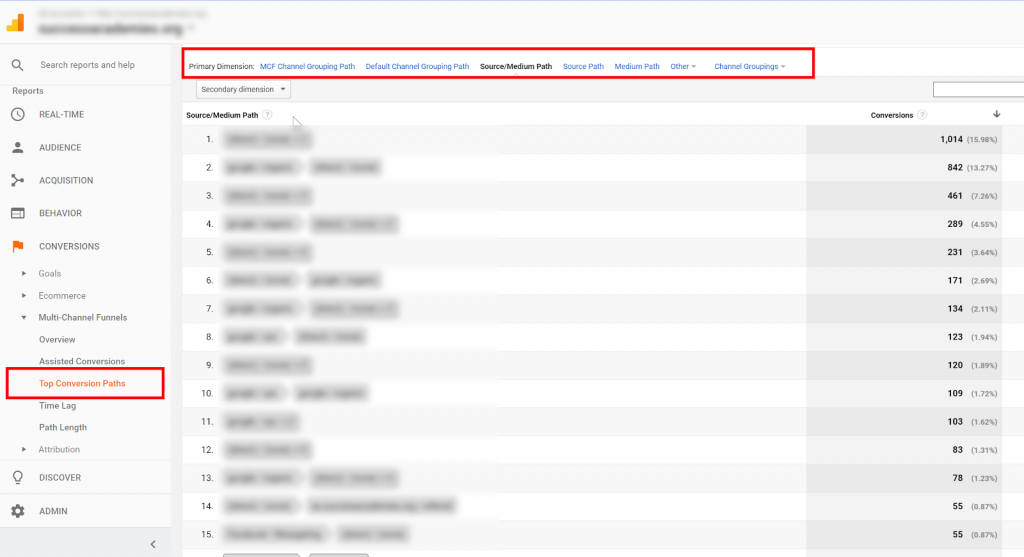
You can access the Top Conversion Path under Conversions in the left side nav.
Once in the report, you can analyze the conversion paths by your primary dimension
Google Analytics Features #5 – Custom Dimensions
Appending all ad URLs with the five standard UTM parameters are crucial to understanding campaign performance across channels.
But the insights only go so far. Appending custom parameters can open the possibilities to track a lot more.
Luckily you can assign custom parameters to custom dimensions allowing you to collect and report any custom values.
You can reference my post on how to map custom parameters to custom dimensions using Google Tag Manager to test this up.
Conclusions
Above I have covered some simple but often overlooked Google Analytics Features.
What features have you leveraged to maximize Google Analytics?
Leave a comment