Killing non-converting Search Campaigns? Make sure to check these Data-Driven Attribution Metrics first.
Written by: Gabriel Solberg Read time 6 minutes
The limitations of data-driven attribution tools are one of my most significant challenges in the world of digital marketing today.
No one has yet mastered a way to seamlessly collect and track data across multiple devices and channels throughout a customer’s fragmented journey.
Existing Attribution Tools
You can access attribution and assisted conversion reports that are available within Google Analytics and Adwords although these are cookie-based.
There is also emerging technology tackling the cross-channel and device attribution dilemma. Such as Facebook and Google taking a people-based approached leveraging logged-in user data and Oracle attempting to unify this front with their translation layer or ID Graph.
Attribution inside of Adwords
Although data-driven attribution can involve an article in itself as a digital marketer, I do have access to some specific actionable attribution data points.
In this blog post, I go over using data-driven attribution metrics, click and impression-assisted conversions, within the Adwords landscape.
Why Analyze Click and Impression Assisted Conversions?
Analyzing click and impression-assisted conversion data enables me to establish which higher funnel awareness and mid-funnel consideration campaigns are assisting lower funnel direct response campaigns.
An E-commerce Example
I was working on a medium-sized E-commerce account equally distributing volume and spend against consideration (read product category searches) and purchase intent (read shopping campaigns).
Success for my efforts was defined strictly by the last-click attribution model, which we know is the weakest but most tangible (or satisfying) attribution model, and I saw that shopping ads were by far outperforming search ads.
Short Term Improvement
As a result, I cut back significantly on the product category (consideration stage) search budget.
The first month did great overall cost went down we maintained sales volume, and our account level CPA improved dramatically. But in the second month, our shopping campaigns dipped in volume significantly.
Understanding the Purchase Cycle
I did not consider the full purchase cycle when implementing the changes mentioned above and made the mistake of treating the mid-funnel search campaigns as direct response campaigns.
Relying on last-click attribution model was inaccurate since naturally, users in the consideration stage are not ready to make a purchase.
Reaching Users in the Consideration Phase
The solution was to make sure we maintained exposure on mid-funnel searches by running search ads in addition to shopping ads.
This strategy would provide brand exposure for customers that are in the consideration phase which directly impacted sales once the user was ready to make a purchase.
Leveraging Attribution Data
But how can we effectively measure mid-funnel campaigns?
By looking at impression-assisted and click-assisted values in the Adwords channel I was able to not only understand how these mid-funnel campaigns were impacting direct response campaigns but also optimize them using click and impression-assisted data-driven attribution metrics.
Note:
Make sure your conversion window is accurately defined and that you are tracking conversion with an Adwords Conversion pixel so that Adwords can properly attribute conversion in the given conversion window.
Google Analytics records conversions the day they happen, and the user’s traffic source in GA right before the final purchase is not necessarily coming from Adwords so importing conversion from GA can skew the Adwords, Attribution model.
The industry I was working in had a purchase window of 30 days.
Data-Driven Attribution Metrics
The following is a step-by-step walkthrough of accessing and analyzing assisted conversion data.
I primarily use this approach with E-commerce campaigns, but this can also be applied to lead gen campaigns, given that events are correctly tracked using the Adwords conversion pixel.
You can analyze the assisted conversion data can on the campaign, ad group, or keyword level.
Choosing where this makes the most sense depends on the account structure.
Usually, I find myself looking at Ad Group and Keyword data for each Campaign.
Ok, let’s get started…
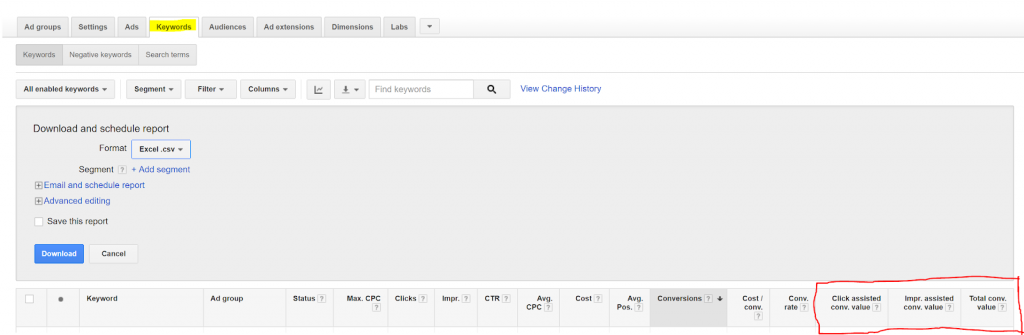
In the keyword view, include the Ad Group, Cost, Total Conversion Value, Impression Assisted Conversion Value, and Click Assisted Conversion Value columns.
Set the date range to at least 30 days back; even though, the more data you can collect here, the better – especially in a B2B environment where there usually tends to be a longer path to purchase.
Note:
I like to analyze most of my data in Google Sheets, but for larger data sets and pivot tables, I have found Excel to be more efficient.
Export your campaign, save the file on your computer, and open it in Excel.
Make sure your column headers are in the first row. Usually when exporting from Adwords Google places the date range at the top. Delete that row(s).
Pivot Tables
I am going to walk through the basic steps of creating a Pivot table but here is a great post from Carrie @ Hanapin Marketing Pivot Tables Made Easy: The Last Demo You’ll Need if you are new to pivot tables.
Select all your cells go to home insert select Pivot Table and run a pivot table.
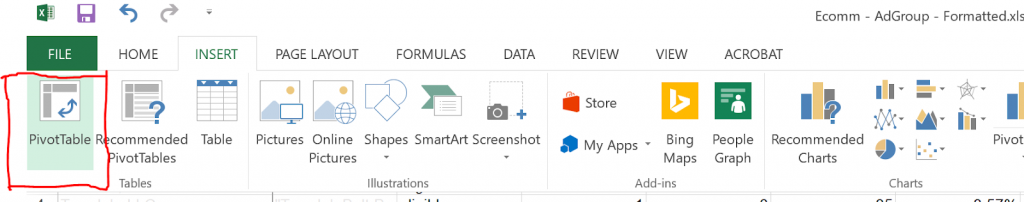
For this exercise, we can keep the basic setting.

Hit OK and you will see a new sheet added to your workbook that looks like this:
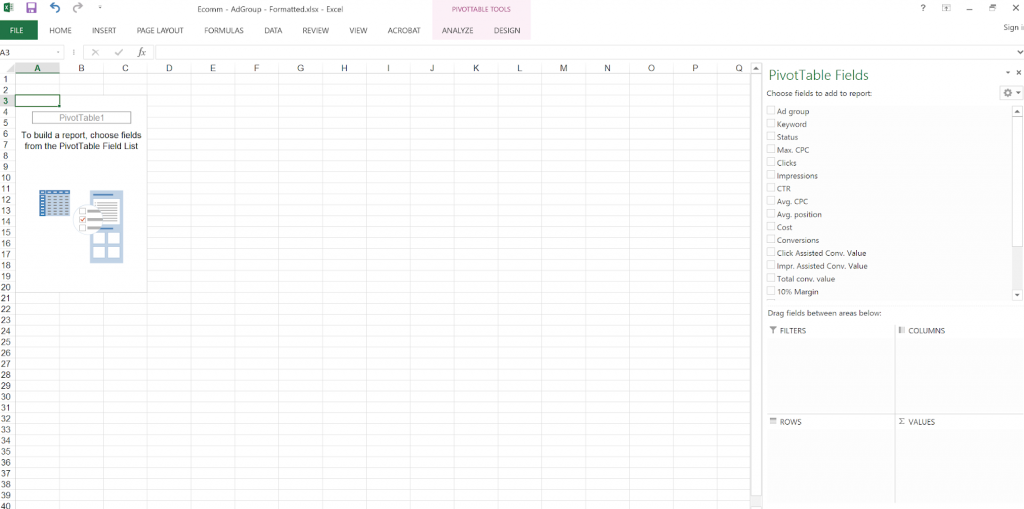
We will now set up our pivot table columns and rows so that we can start analyzing the data.
Pivot Table Rows:
Ad Groups
Keywords
Pivot Table Columns:
Cost
Total Conversion Value
Impression-Assisted Conversion Value
Click Assisted Conversion Value
On the right-hand side of your worksheet select Ad Group and Keyword and add them to rows
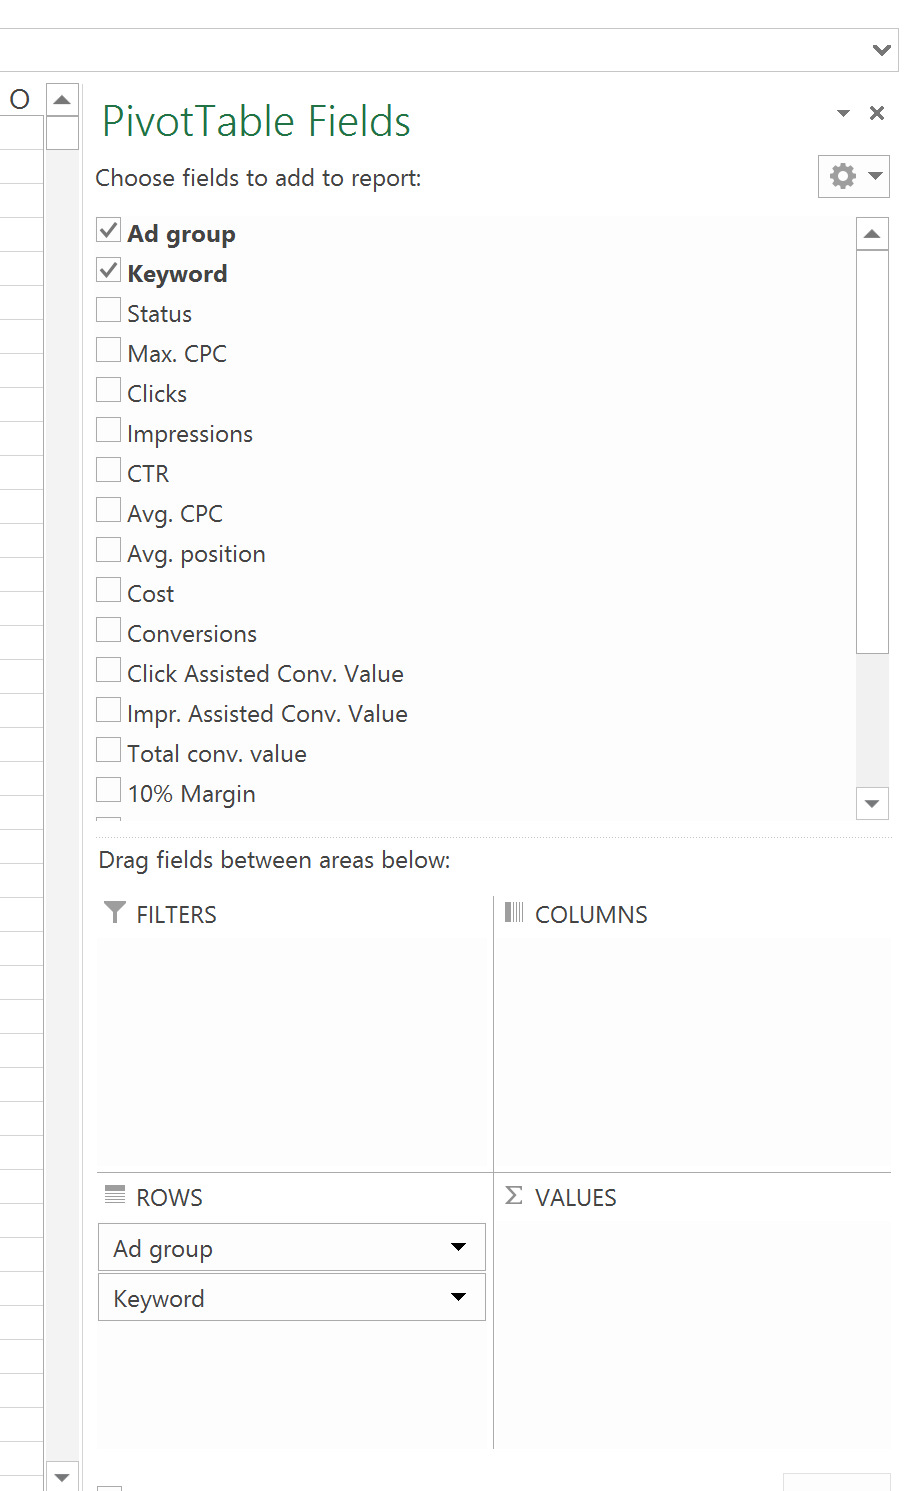
By default all of your
Ad Groups will be expanded.
To collapse all select the first ad group hit CTRL + Shift + Arrow Down to select all then Right Click > Expand / Collapse > Collapse
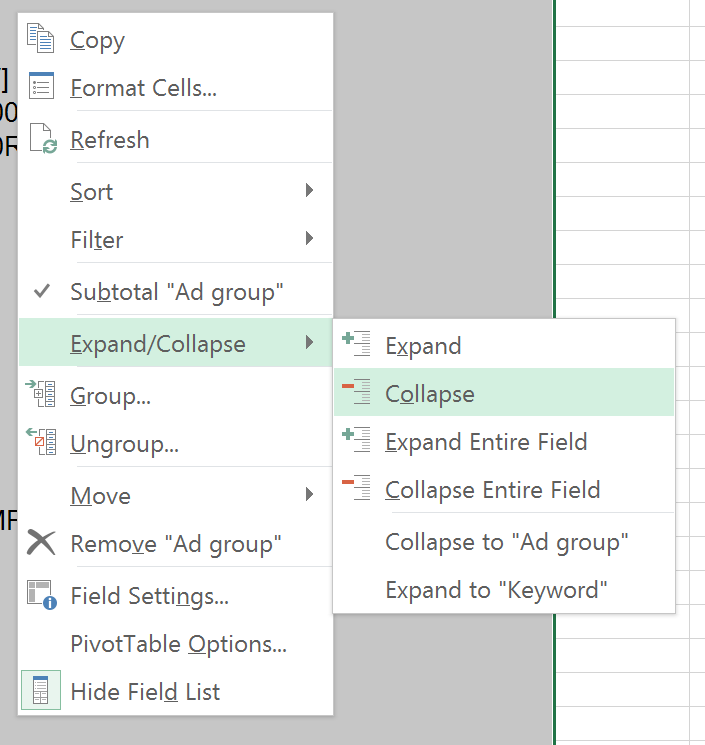
This makes it easier to read at this stage.
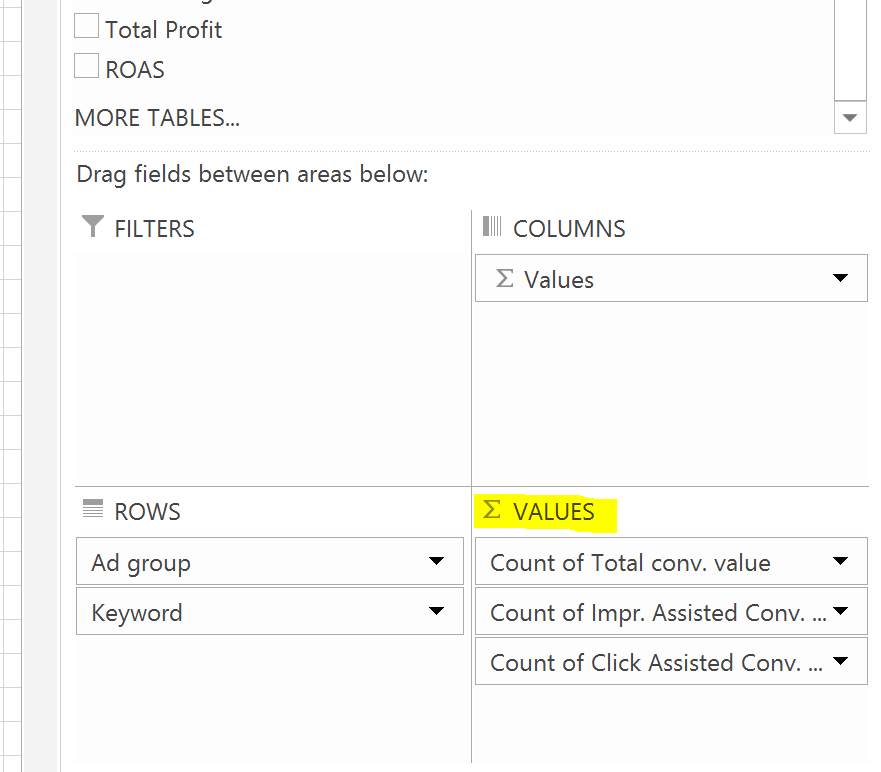
Next, drag the metrics fields we want to analyze into the Value area.
The metrics we want are:
Cost
Total Conversion Value
Impression-Assisted Conversion Value
Click Assisted Conversion Value
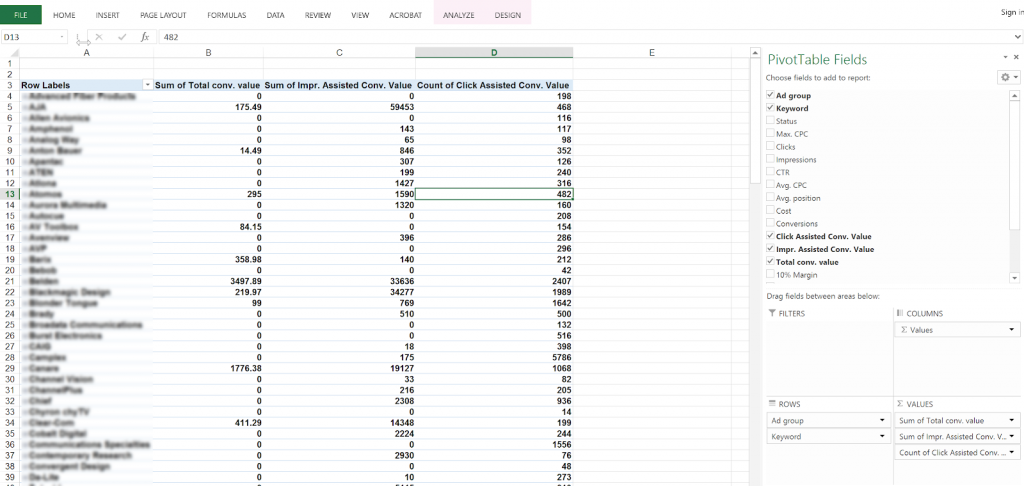
Make sure that the field value is set to SUM if not click on the down arrow next to the field name and go to Value Field Settings…
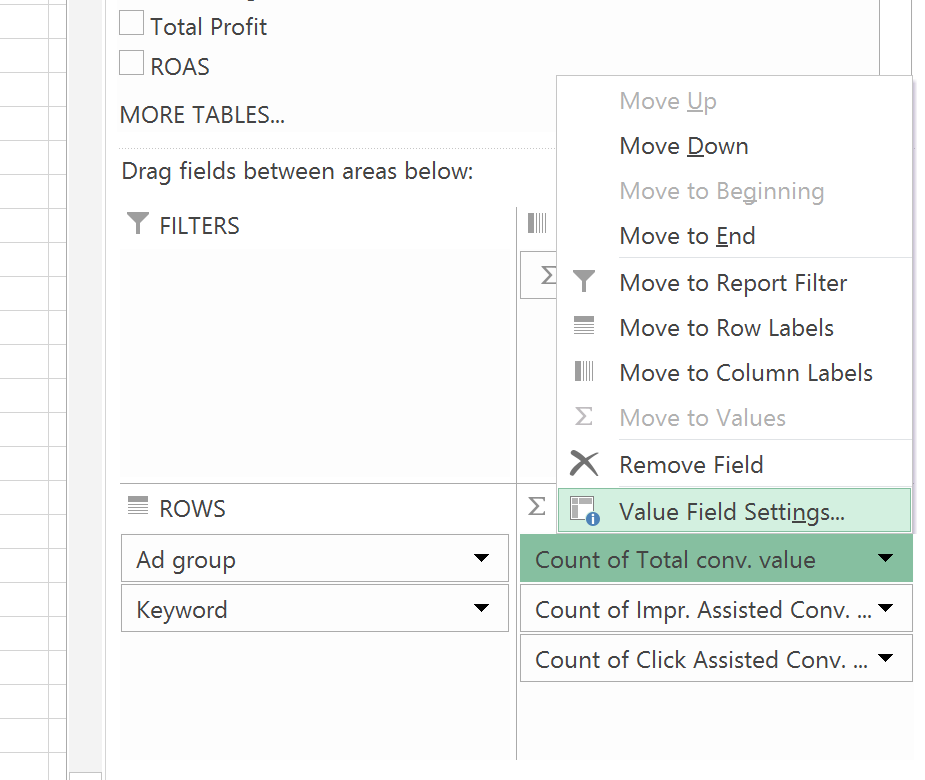
And change ‘Summarize Values By’ from Count to SUM
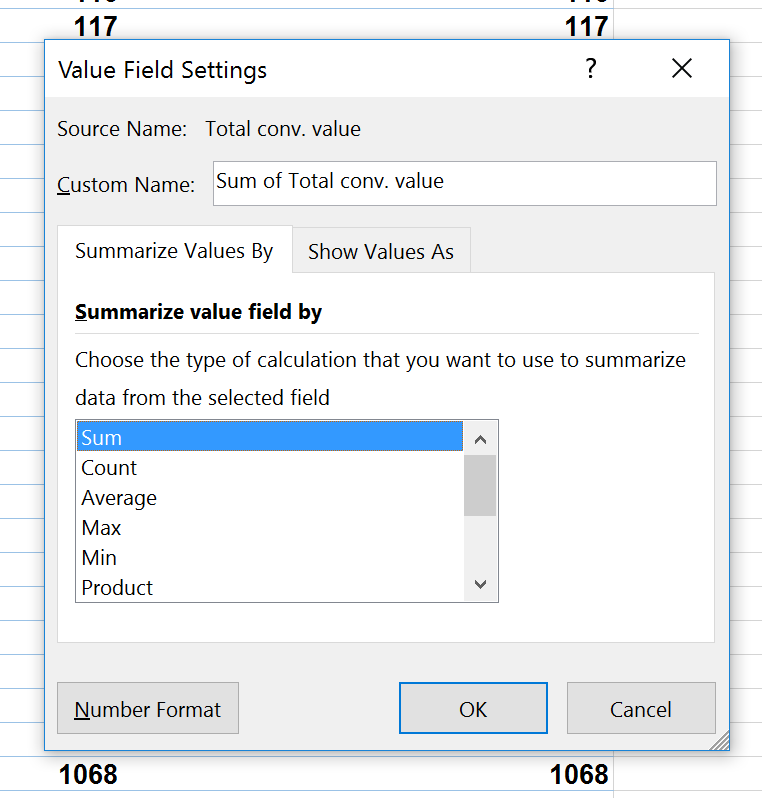
Hit ok and you should have something like this
Defining Conversion Values
Now I know there is a definite crossover in conversion value across last click conversion value (default) vs. click-assisted and impression-assisted conversion value. This means the conversion value data we are looking at here is most likely inflated.
Keeping this in mind we are going to take a % value and assign one to each conversion and assisted conversion value. This % value varies from organization to organization based on what their margins look like.
For this example, I will assign the following:
Total Conversion Value: 30% Margin
Click Assisted Conversion Value: 10% Margin
Impression Assisted Conversion Value: 5% Margin
Having this in place, I will then create four additional columns using calculated fields in excel:
30% Margin of Total Conv. Value
10% Margin of Click Assisted Conv. Value
5% Margin of Impression Assisted Conv. Value
Total Profit – Adding all three ‘Margins’
ROAS – Subtracting total profit from Total Cost
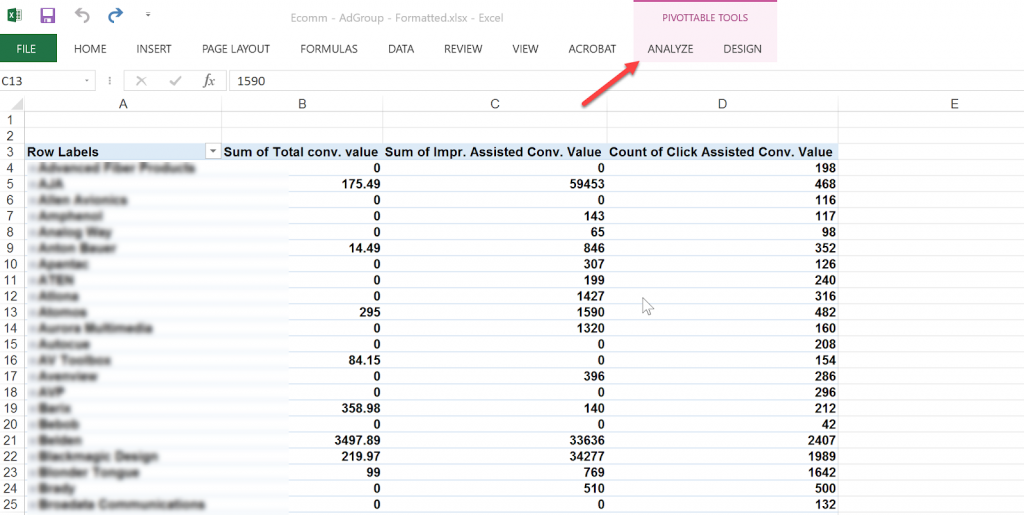
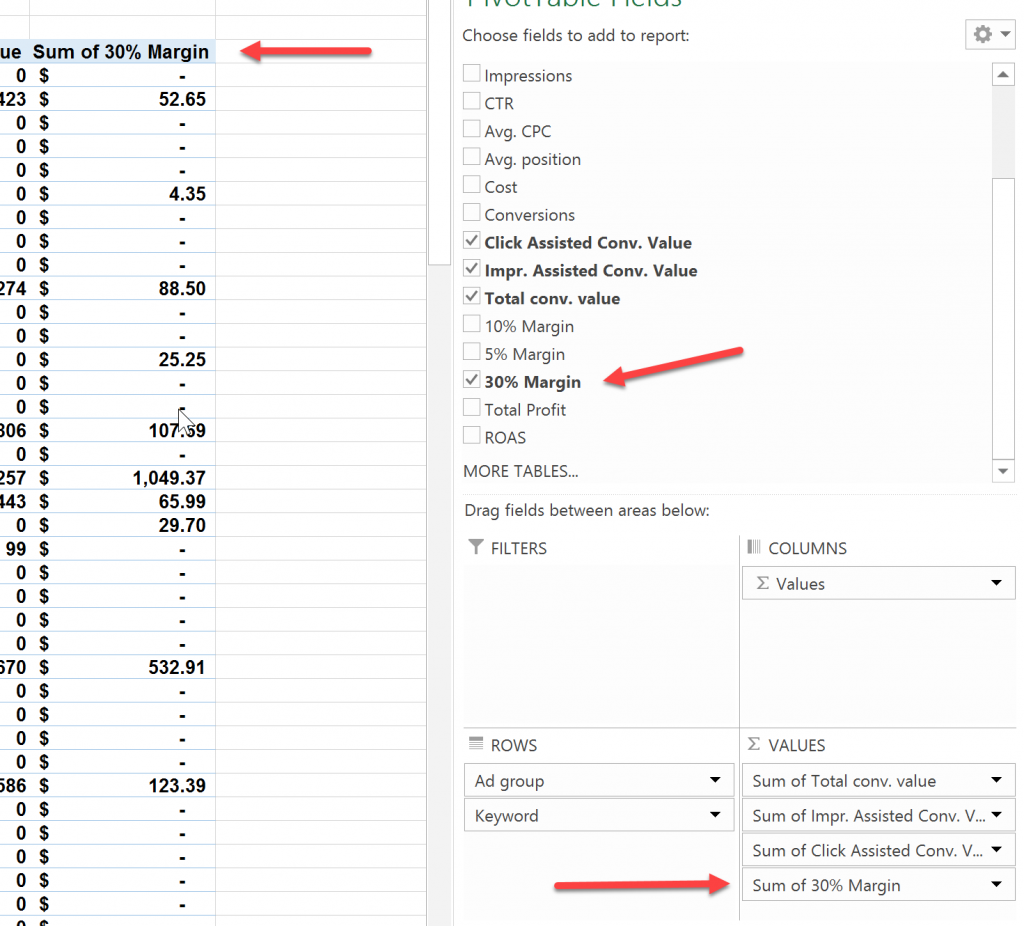
To do this select any cell in the pivot table and go to Analyze in the top right
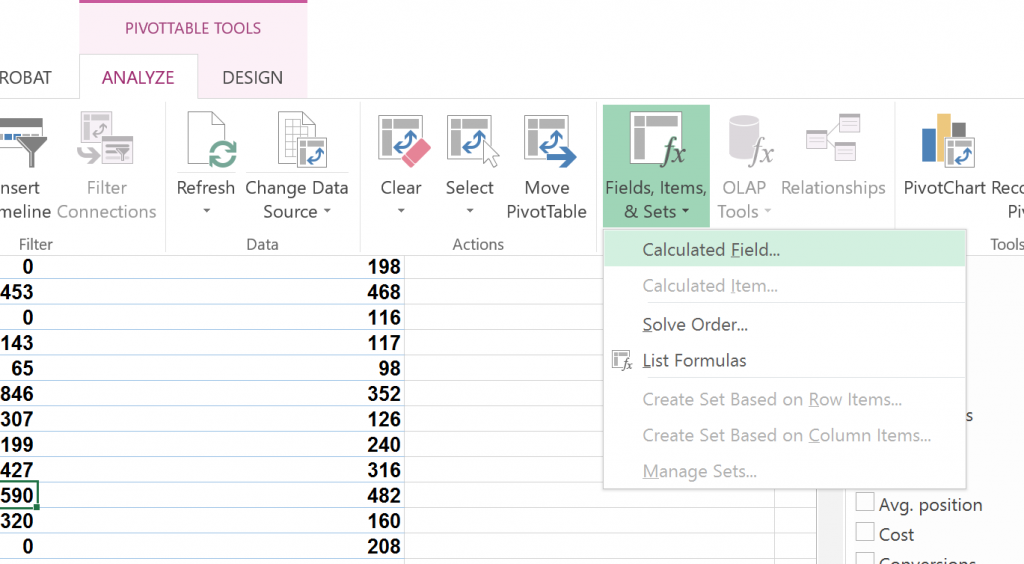
Go to Fields, Items, & Sets > Calculated Fields
The formula is multiplying each field value by the % I have outlined above so to calculate the Profit Margin value for Total Conv. Value we want to multiply Total Conv. Value by .3 (30%)
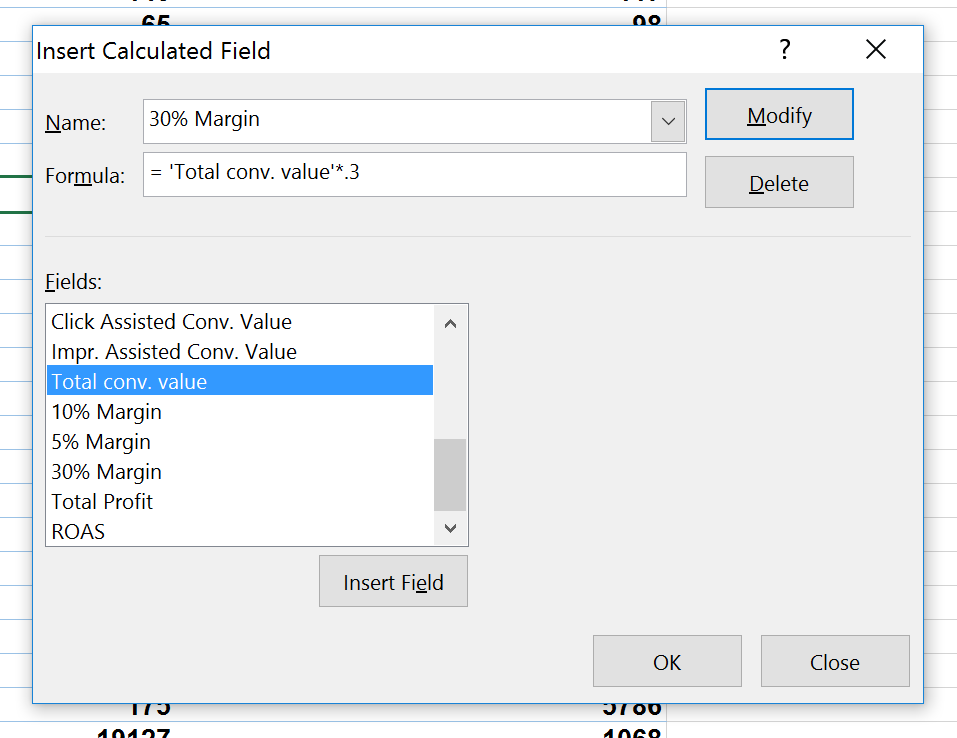
Click OK and you should see an added column called Sum of 30% Margin which can be accessed like all other Pivot Table fields on the right.
We will need to create two more one for Impression Assisted Conv. Value and another for Click Assisted Conv. Value multiplied by .05 ( 5%) and .01 (10%) respectively.
After I have created the above I want to create two more custom-calculated fields:
Total Profit – Adding all three ‘Margins’
ROAS – Subtracting total profit from Total Cost
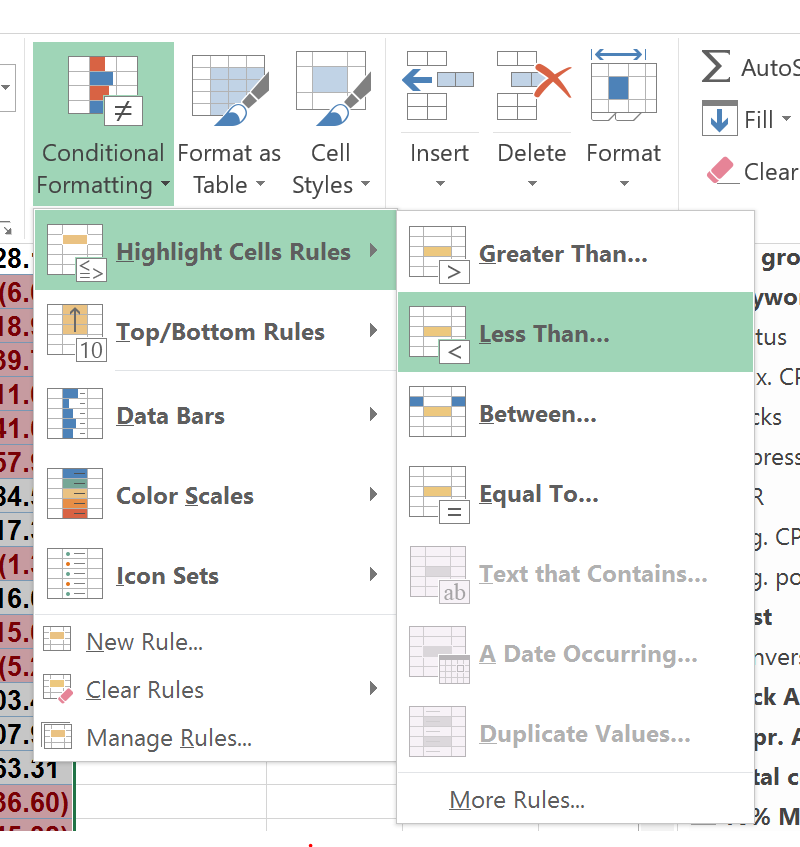
I then, for clarity, assign a cell rule that highlights all cells with a negative value in the ROAS column.
Select the top cell in the ROAS Column and Hit CTRL + Shift + Arrow Down to select all.
Go to Home > Conditional Formatting > Highlight Cell Rules > Less Than…
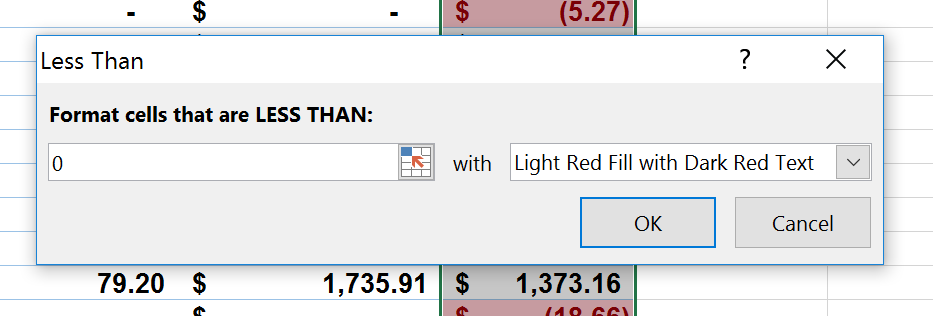
The final result looks something like this:
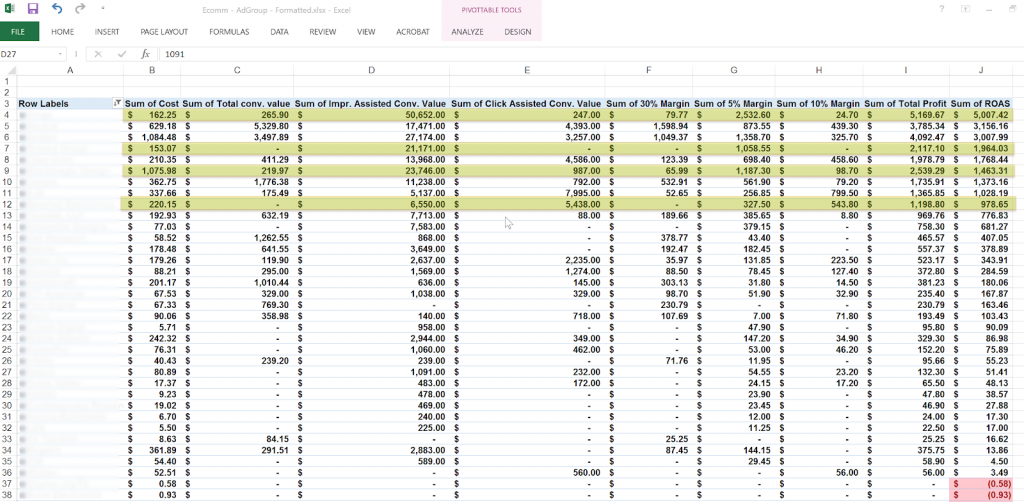
Making Sense of the Data
I have highlighted rows on the screenshot above where there is no or a low conversion value but our ROAS is strong. These are prime examples of Ad Groups that are assisting lower direct response campaigns.
However, if the ad group ROAS is below zero (highlighted in red) I look at the product/category performance both within AdWords, across other channels and hard sales data to determine if it’s a strong performer and worth pursuing or whether it is a weak product/category that does not make sense to support.
I will then drill down into keywords and analyze search queries looking to optimize towards keywords that are providing last clicks, assisted click, and impression-assisted conversions and reducing or eliminating keywords that are not showing profitable performance.
Yes, it works!
Looking at product categories and product search campaigns using data-driven attribution allows me to optimize the account holistically driving effective volume, efficient ROAS, and sales over a given conversion window.
This is only a piece of the puzzle, but I have seen improved performance account-wide when optimizing campaigns higher in the purchase funnel.
How have you worked with data-driven attribution in your AdWords account?
AUTHOR BIO:

With over a decade of digital marketing experience, Gabriel excels in search, display, and social advertising across various industries. He specializes in performance media and data-driven storytelling, building custom digital ecosystems that enhance user experiences across both paid and owned channels. Connect with Gabriel on LinkedIn or explore more of his articles here.
Leave a comment