Supermetrics – The #1 Reporting Tool for Digital Marketers
Written by: Gabe Solberg Read time 9 minutes
Before we take an insider look at Supermetrics (https://supermetrics.com/) let’s review the disadvantages of the current reporting landscape.
As digital marketers, we are always on the lookout for the perfect reporting tool. A simple tool that will blend data across channels and produce cohesive dashboards. All this, while still being flexible enough to produce quick and dirty ad hoc reports. In my world, such a reporting unicorn does not (yet) exist. It is virtually impossible to create one go-to reporting tool that works seamlessly across all Martech stacks.
The reporting saga
Let’s say the goal is to track everything, report on it, and provide golden nuggets aka meaningful data insights. This is easier said than done. What happens more often than not when trying to create immaculate and beautiful reports? You get bogged down in the process of tracking nuances and stitching data together to build a report that only looks good on the surface.
Oh and while you are at it, you have to make sure you’re spending time on optimizing messaging, creative and the algorithm 🤯.

In no way am I downplaying the importance of accurate tracking and actionable reporting. I’m just saying that tracking and reporting are a means to an end, not the actual end.
In other words, a beautiful report is not the “Golden Nugget”, the actionable insights are. Sorry to all the OCD and somewhat neurotic digital marketers out there; myself included.
Effective (poignant) reporting
To be effective with reporting is to establish a clear objective and goal for each campaign. This requires that you define each step or series of steps in a funnel. Then track and ensure accuracy for those specific events.
Yes, this means ignoring imperfect event tracking or system structures.* Work with what you’ve got. Ensure that key funnel steps for your focus channels are firing properly.
Ignore the overwhelming volume of available metrics. Stop trying to create one beautiful dashboard that will tell you everything.
You are better off analyzing performance by referencing ad platform dashboards directly. As long as each one contains data around your key funnel events. However, if you do this make sure you understand the attribution nuances.
*Note: Every organization operates within their own set of priorities. System structures should always be set up properly and taking the time to do this is well worth it in the long run. However, you don’t always have the luxury to wait for internal teams to prioritize marketing requests. Instead, make sure the focus funnel metrics and events are set up correctly. This way campaigns are not held back by other team priorities.
Leverage the data you need not [all] the data you have
What is my priority when I am handed a new account? Extract micro and macro KPIs that translate to meaningful actions. I can then use these KPIs to build a funnel. Doing this effectively means ignoring non-relevant metrics to remove the noise. I can always revisit these since they can be useful at a later time.
The focus KPIs typically consist of:
Platform metrics (i.e. Facebook, Google Ads)
User Behavior (i.e. Google Analytics, Heap, Mixpanel)
On-site goal completions via Google Analytics i.e. Add to Cart, Sign Up
Conversions such as a purchase or qualified lead (Facebook, Google Ads, Google Analytics, Heap, Shopiyf, Mixpanel, Salesforce, Pipedrive)
So the question is what is the best way to collect data for reporting purposes. Do I want to build a dashboard? Data Studio could do the trick. This way I can mix graphs and tables for a more digestible way to consume the data.
Or maybe, to start I want to figure out how and what to look using raw data. For this spreadsheets are my best friend.
So what is the best tool to collect your data and how the heck does Supermetrics fit into all of this?
Supermetrics
See Supermetrics certainly got one thing right. They kept it simple. Supermetrics gives you the freedom to decide how, when, and where to pull your data and in your preferred format. Rather than try and build an ultimate (somewhat frustrating) no-code visual reporting experience their simplicity makes them extremely effective.
Don’t get left behind!
Join the digital marketing pros and let Supermetrics become your one-stop-shop for all reporting needs.
With Supermetrics, you will have the advantage of leveraging free (and paid) reporting tools. Integrations include Google Sheets, Excel, Looker Studio, or the newly released Big Query connection.
So who exactly is using Supermetrics?
Who is using Supermetrics?
When I think of Supermetrics users, I default to PPC advertisers. This is in part because PPC is predominantly what I use it for. Some implicit bias here.
However, Supermetrics can be a powerful tool for more than digital marketers.
SEOs, Content Marketers, Social Media Marketers, Customer Service Teams, Product Teams, and BI Teams can get a ton of value out of the tool.
Basically, the tool can kick ass for any data that you would want to pull. Whether it’s for ad hoc reports, internal or client-facing dashboards 📊.
Now depending on what you want to do with the data, you have a suite of products from which to select. The full suite of products consists of:
- Supermetrics for Google Sheets
- Supermetrics for Looker Studio
- Supermetrics API
- Supermetrics for BigQuery
- Supermetrics for Excel
- Supermetrics Uploader
Note: You can see a full list of available integrations on their site here.
Supermetrics Product Introduction
Below, I will provide an introduction and a brief overview of each one of the following Supermetrics products:
- Supermetrics for Google Sheets
- Supermetrics for Google Data Studio
- Supermetrics for Excel
- Supermetrics Uploader
I will also link out to reporting templates and give you an optional step by step set up guide.
The best product match really comes down to asking yourself a few key questions. What existing tool are you most comfortable and efficient in when you analyze data? Is it Google Analytics (think Uploader), Google Sheets, Excel, Data Studio or a combination of these?
Don’t worry they give you a nice 14 day free trial for each product and if you love it, I can get you a 20% discount. Just ask for it here.
Let’s get started.
Note: This is the first in a series of posts. Following this post, I will share more step by step guides like these:
👉 Google Data Studio Facebook Reporting [The Complete Guide]
👉 How to build the ultimate pivot table in Google Data Studio
So keep a lookout 👀 for those.
Supermetrics for Google Sheets
The Google Sheets Supermetrics add on is a simple and scrappy tool to pull data into Google Sheets. If you love spreadsheets and get excited building pivot tables, then this is the product suite you want.
With the tool, you can grab data from one or multiple sources for quick cross channel ad hoc analysis. Alternatively, you can create scheduled reports, including ones made up of graphs and charts. These can be automatically updated hourly, daily or weekly, with an option for email updates.
In addition to pulling data from reporting platforms, you can also connect to Big Query and pull data directly from your custom BI database.
Note 1: Since the data you push to Google Sheets can be segmented, filtered and split in many different ways you can use Google Sheets as a data table for all of your ‘raw’ data. You cab then tie the Google Sheet to Data Studio as a ‘data source’. More on this in a future post.
Note 2: I am a big fan of Google Sheets however if you are working with larger data sets (10,000+ rows) you will want to use Excel.
Templates: You can access their Google Sheets Templates here.
Quick setup guide:
Let’s walk through the set up of the tool’s integration with Google Sheets.
Note: Example given is with Chrome on a Macbook Pro
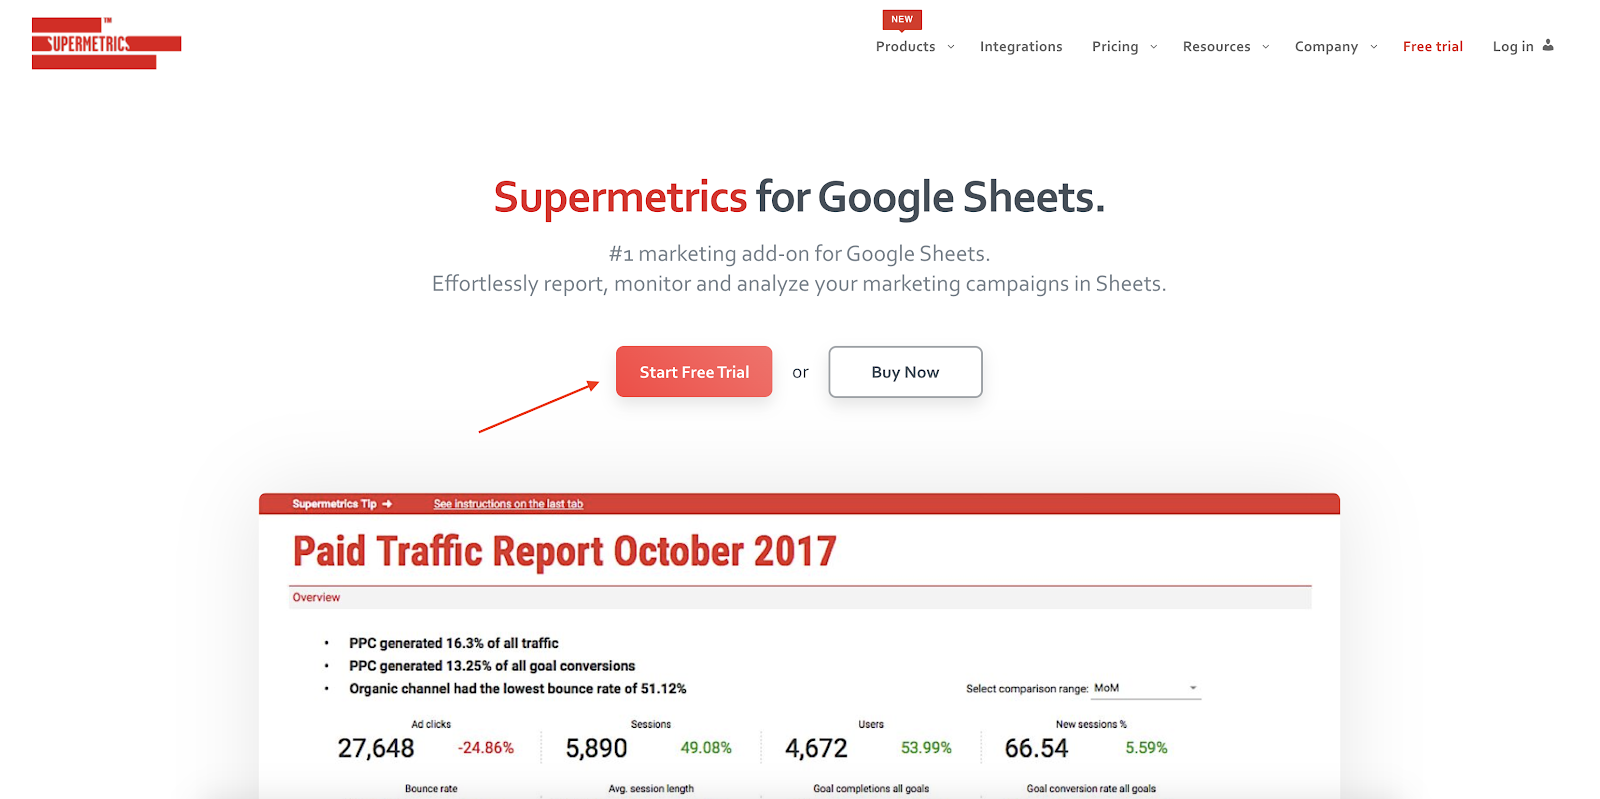
1 – Go to https://supermetrics.com/product/google-sheets
2 – Click Start Free Trial
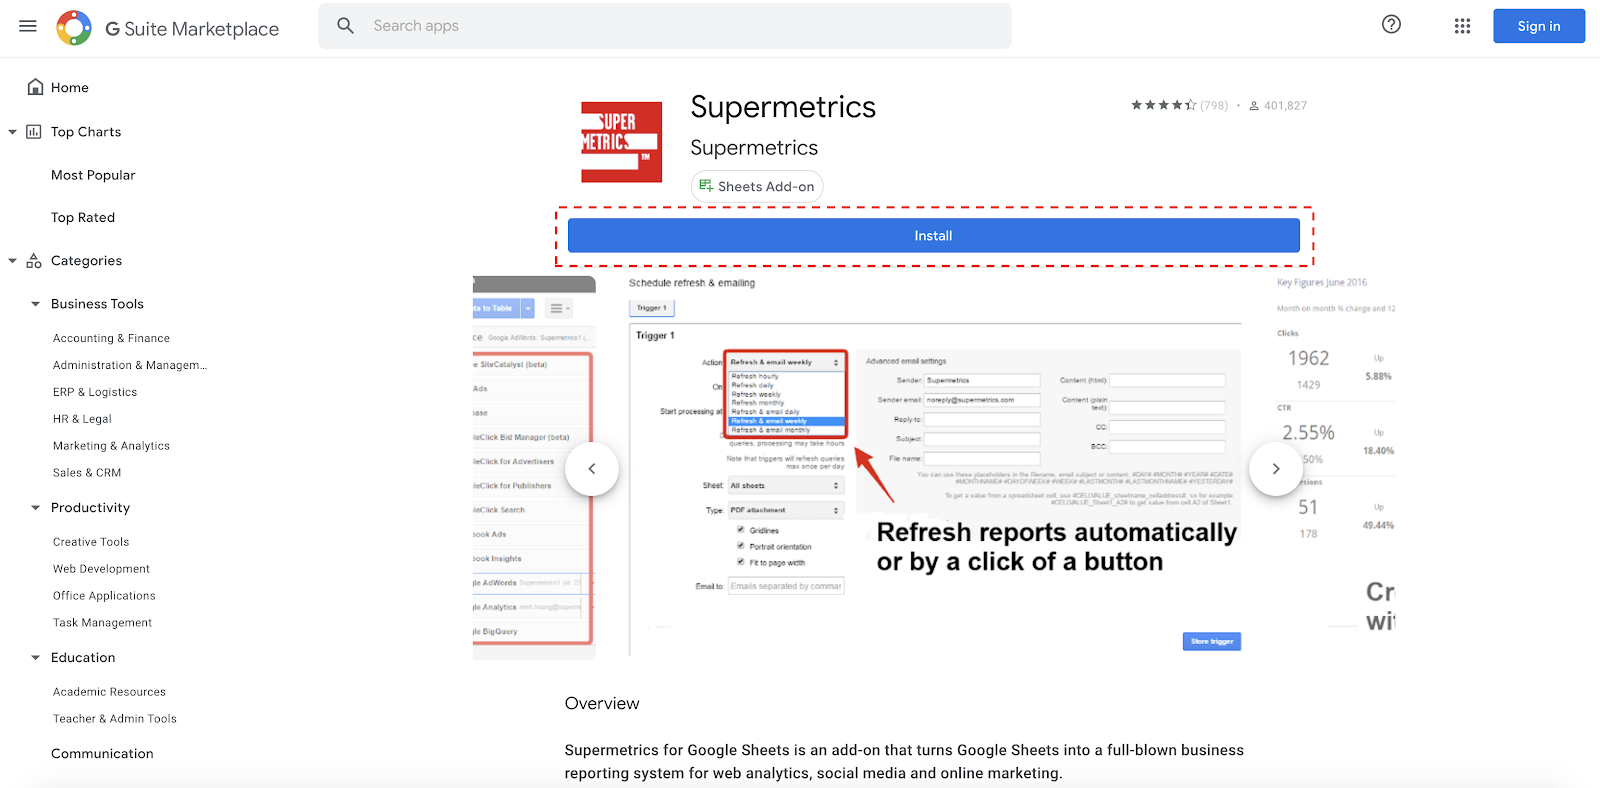
3 – This will take you to the G Suite Marketplace. Click on Install.
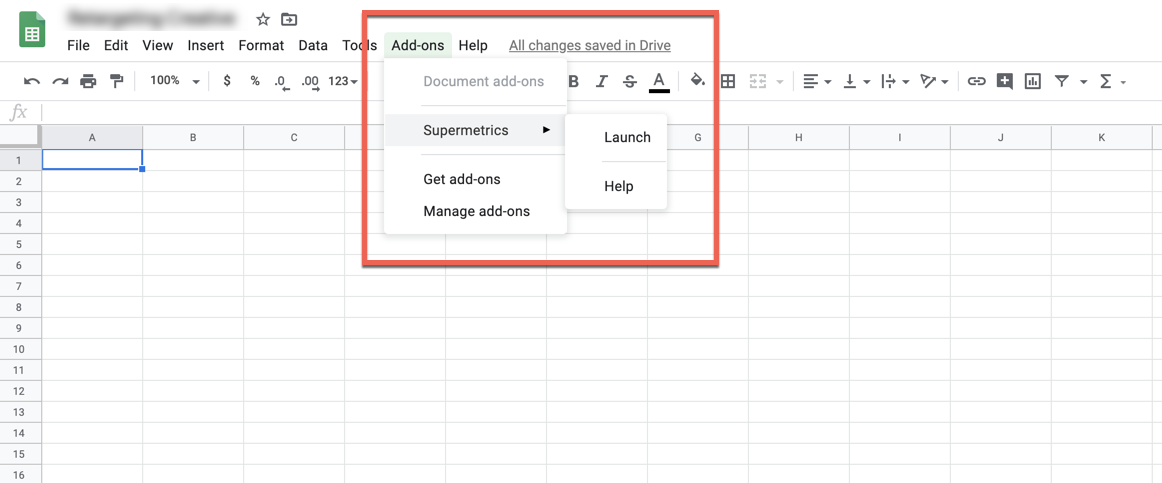
4 – Once installed go to a blank Google Sheet and Click Add-ons > Supermetrics > Launch
5 – You will now be able to access all features in the side panel
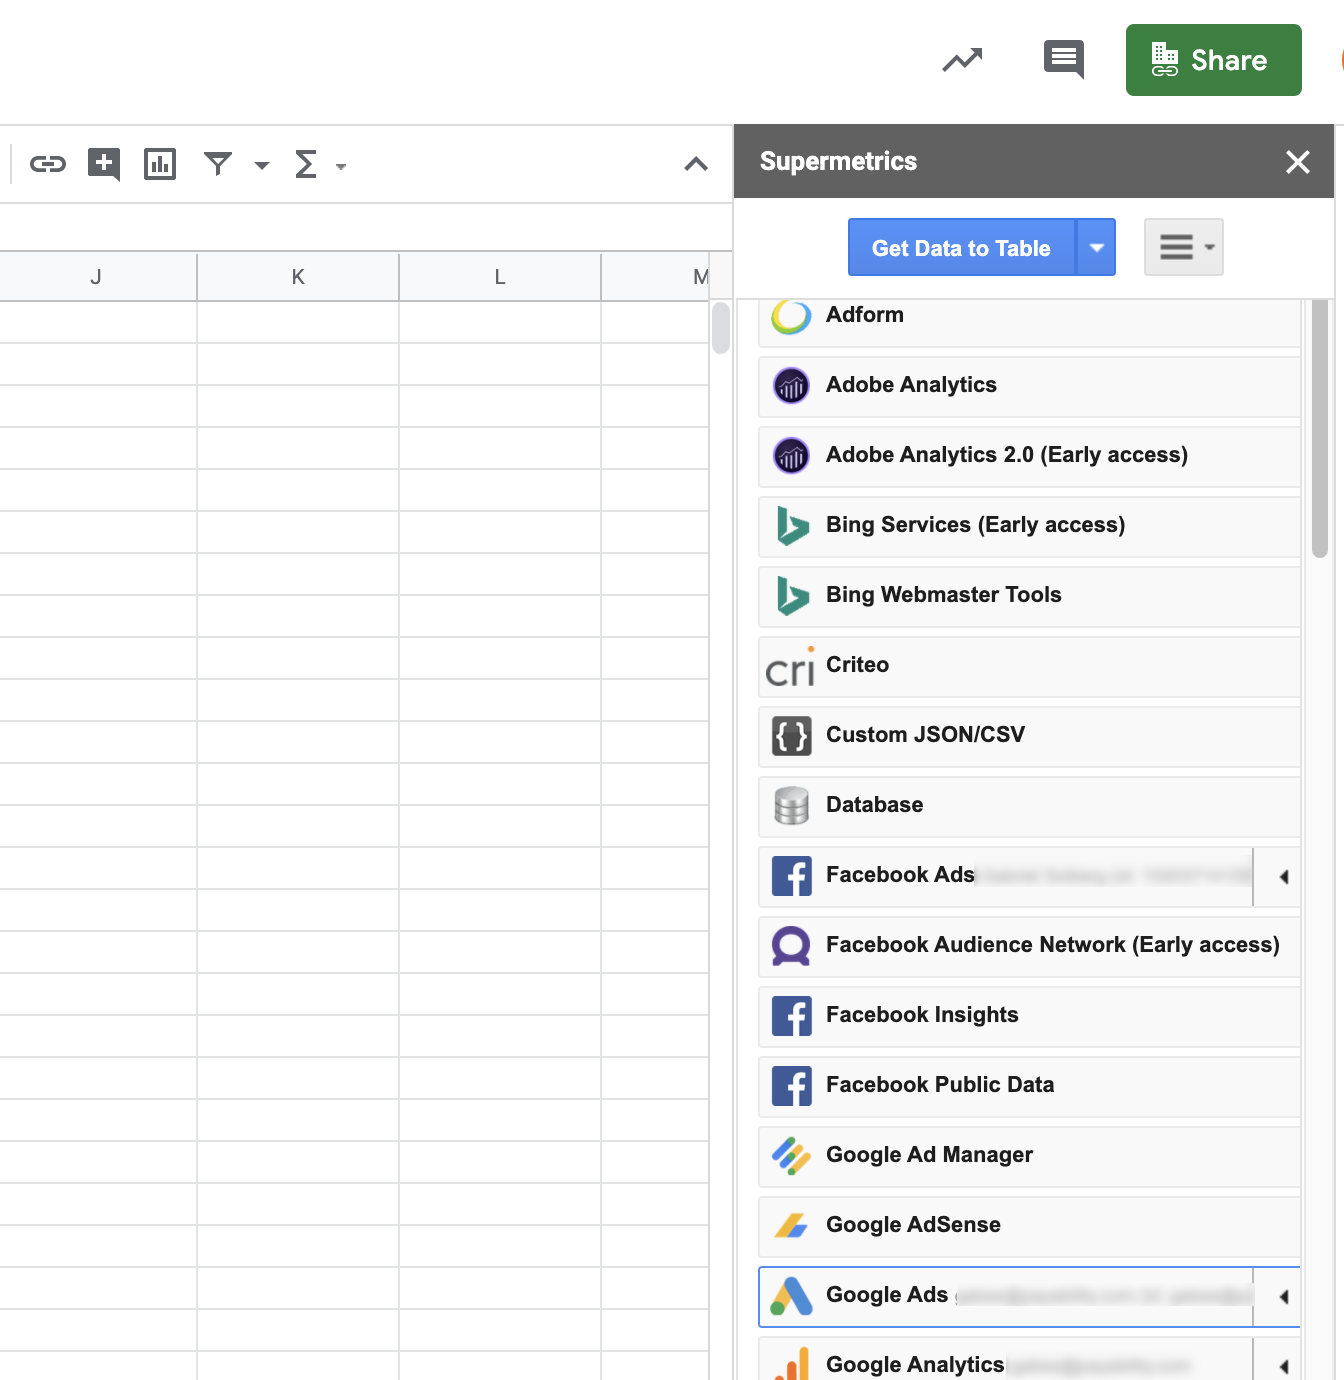
Note: Yes, you get a 14 day trial (trust me it takes less time than that to fall in love).
Supermetrics for Google Data Studio
If you want to pull your data directly into Google Data Studio for visual reporting, Supermetrics Data Studio connectors can prove very useful. You can also use it in conjunction with Big Query which can become super powerful with Data Studios blending feature. Alternatively, you can also push all of your data into Google Sheets from third-party platforms and then add your Google Sheet as a data source in Google Data Studio.
Templates: You can access their Data Studio templates here
Quick setup guide:
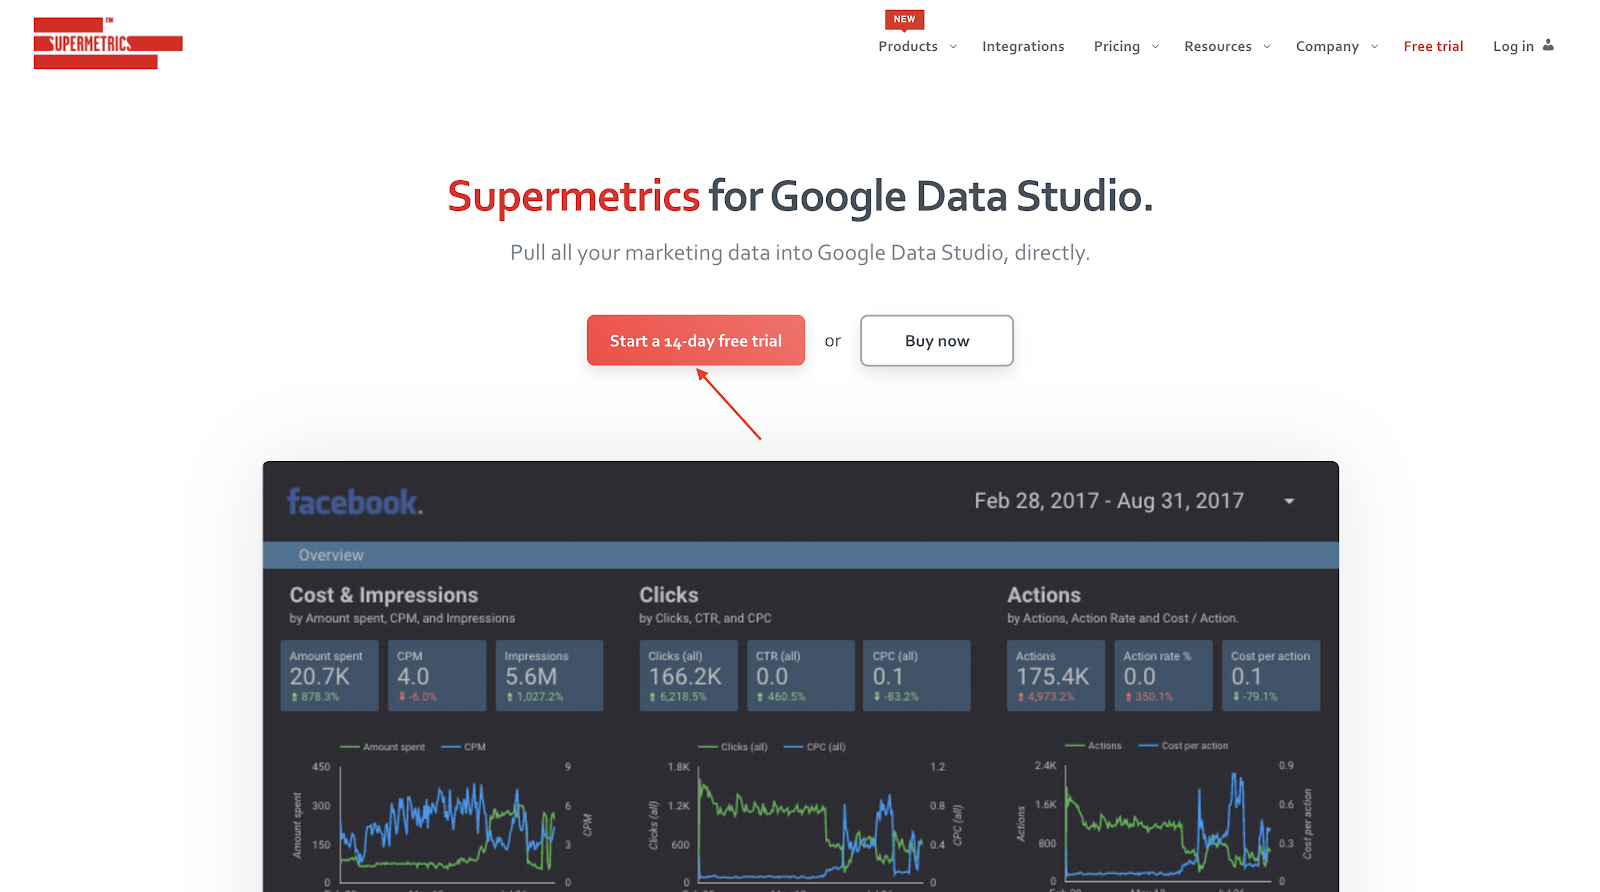
1 – Go to https://supermetrics.com/product/looker-studio
2 – Click on Start a 14-day free trial
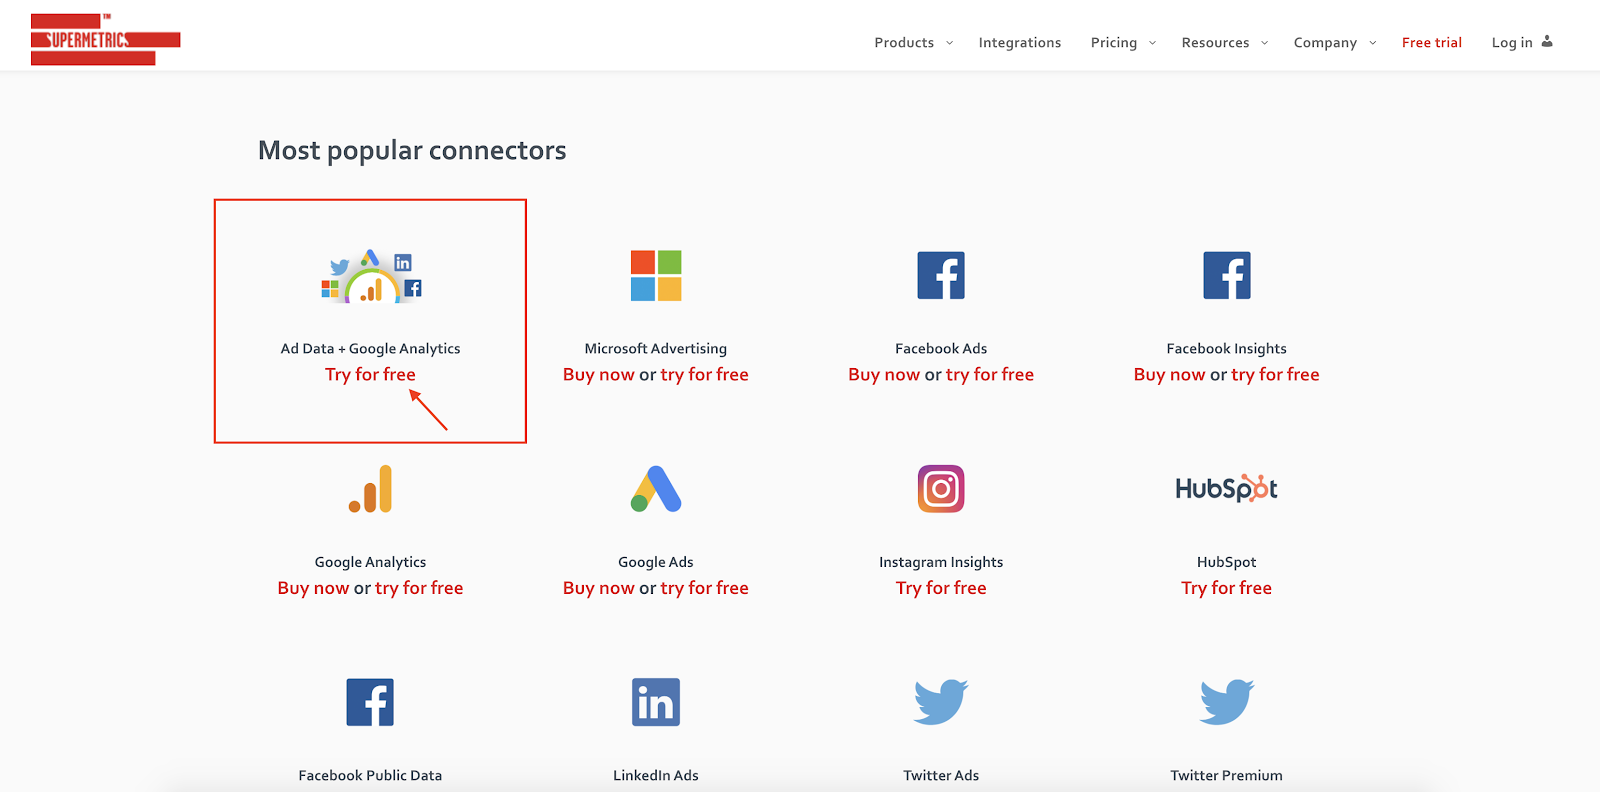
3 – Next, select the connector(s) you need – for this example I will use the Ad Data + Google Analytics
Note: They have a ton of available connectors. Unfortunately you can’t purchase all of them in a single bundle. The closest you can get to a bundle is to select Ad Data + Google Analytics which includes the most popular ad platforms. (See below) However, you can add and remove connectors on a case by case basis as you need them.
Their site is not very clear on what Ad Data + Google Analytics includes. Here are the available platforms you can pull data from with this connector:
Facebook Ads
Google Ads
Microsoft Advertising (Bing)
Twitter Ads
LinkedIn Ads
Google Analytics
4 – Click on Try for free
5 – It will ask you to Authorize the connector
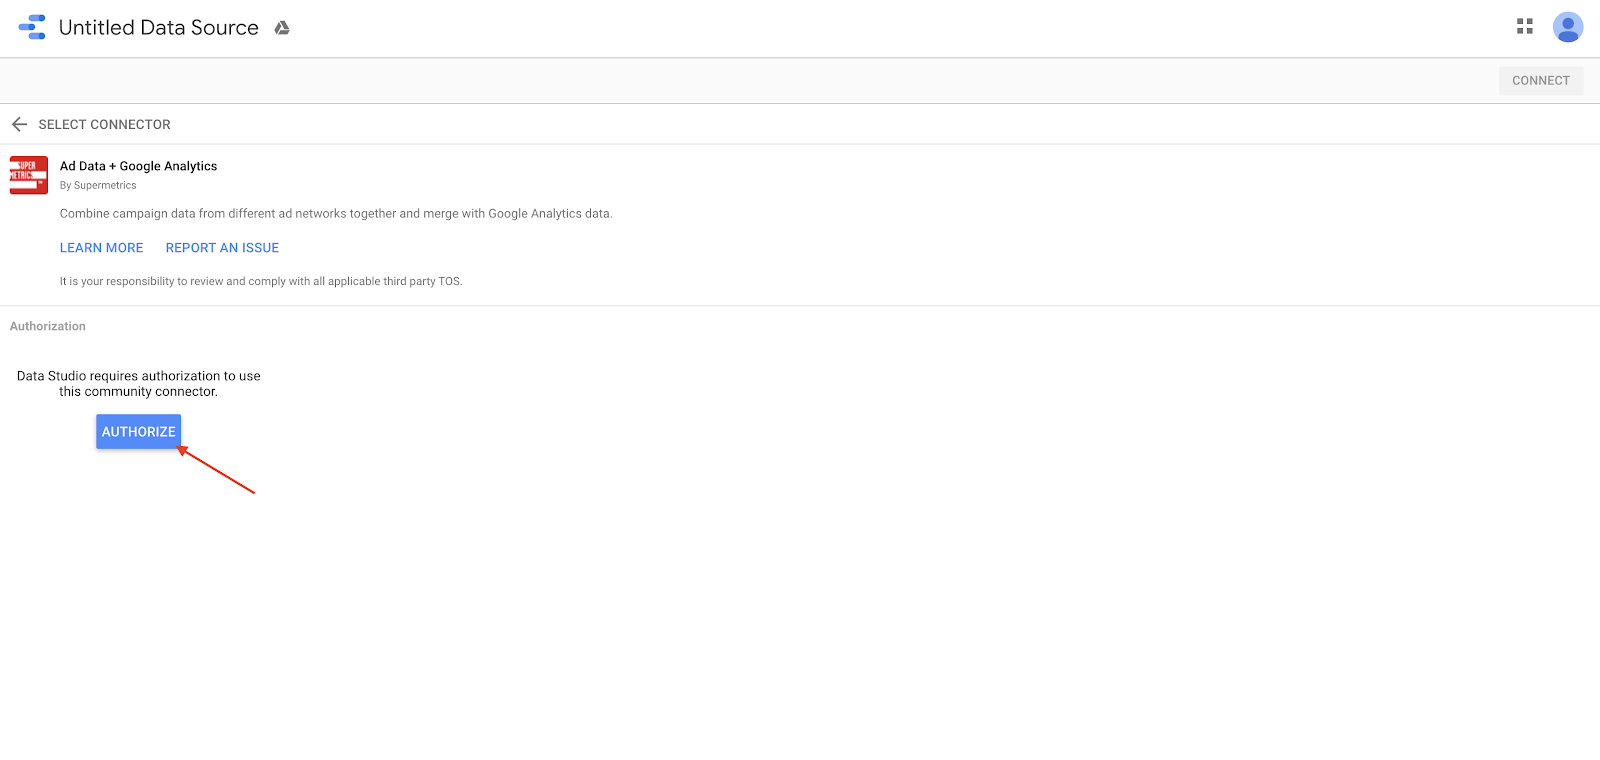
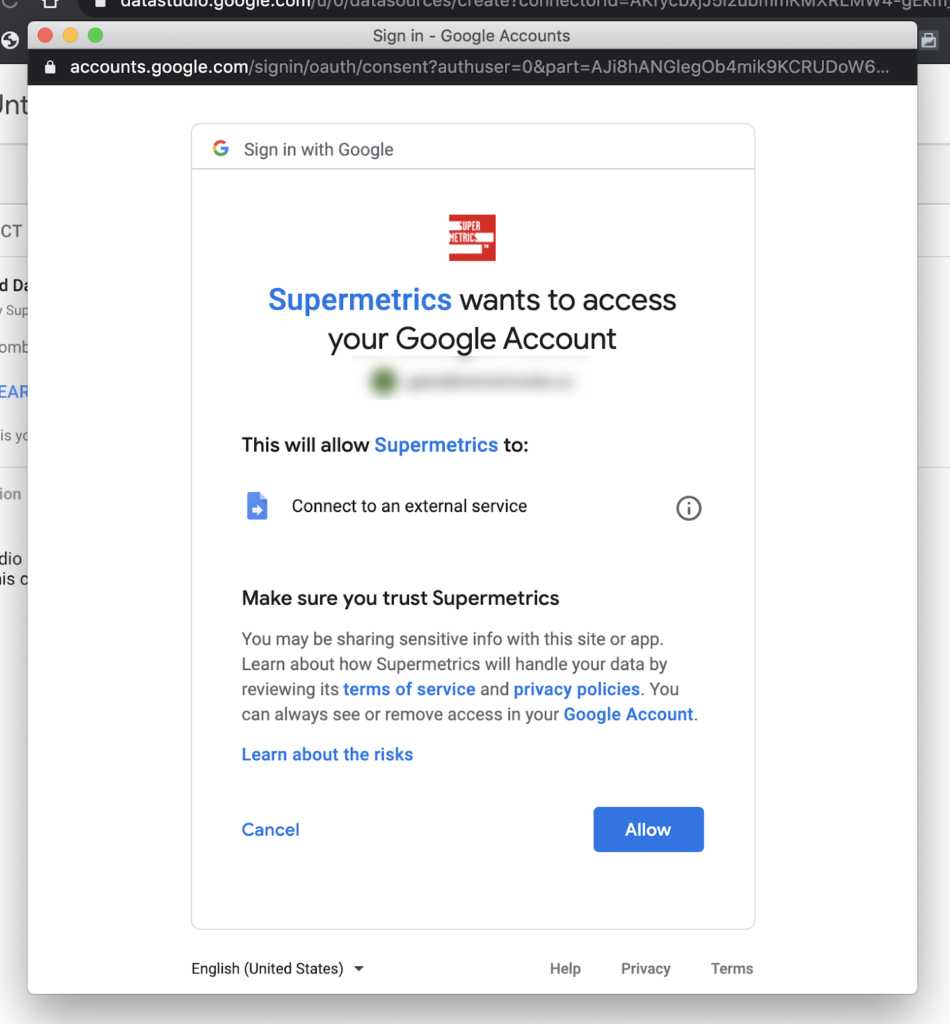
6 – Give the required permissions by clicking Allow
7 – Once you have Authorized the connector, you need to Authorize each specified platform. Which you can do by clicking Log into… (See below)
That’s it! Now you can easily create multi-channel reports in Google Data Studio 🎉.
Supermetrics for Excel
Similar to how the tool functions with Google Sheets, you can get all of your data into Excel via the sidebar. The Excel version has access to the same number of integrations the Google Sheets ad on. Excel is ideal for large data sets with rows greater than 10,000+ rows.
At this point, they do not have any templates for Excel 😞
Quick setup guide:
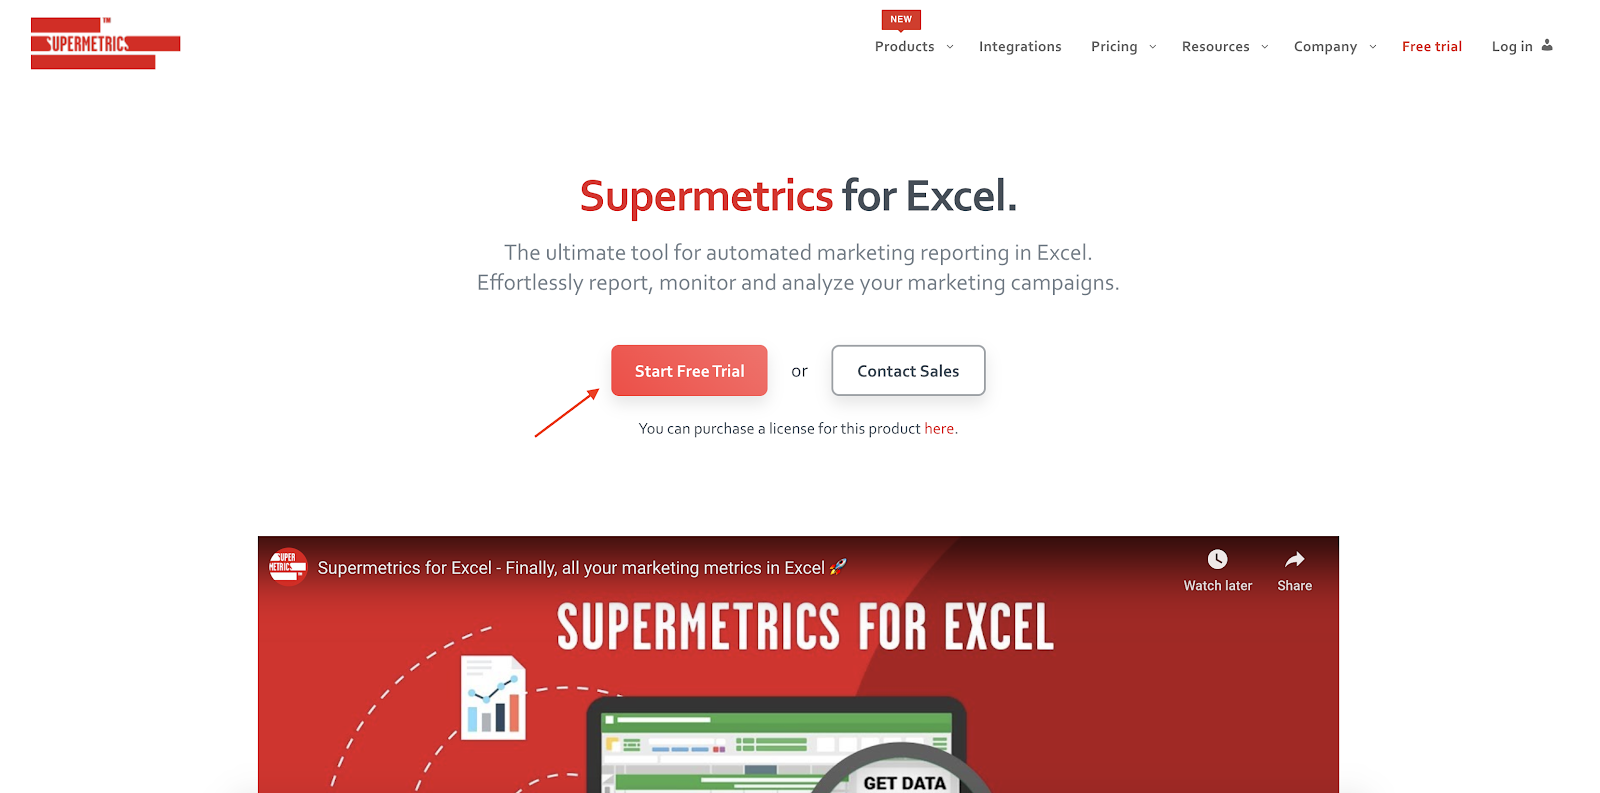
1 – Go to https://supermetrics.com/products/excel and click Start Free Trial
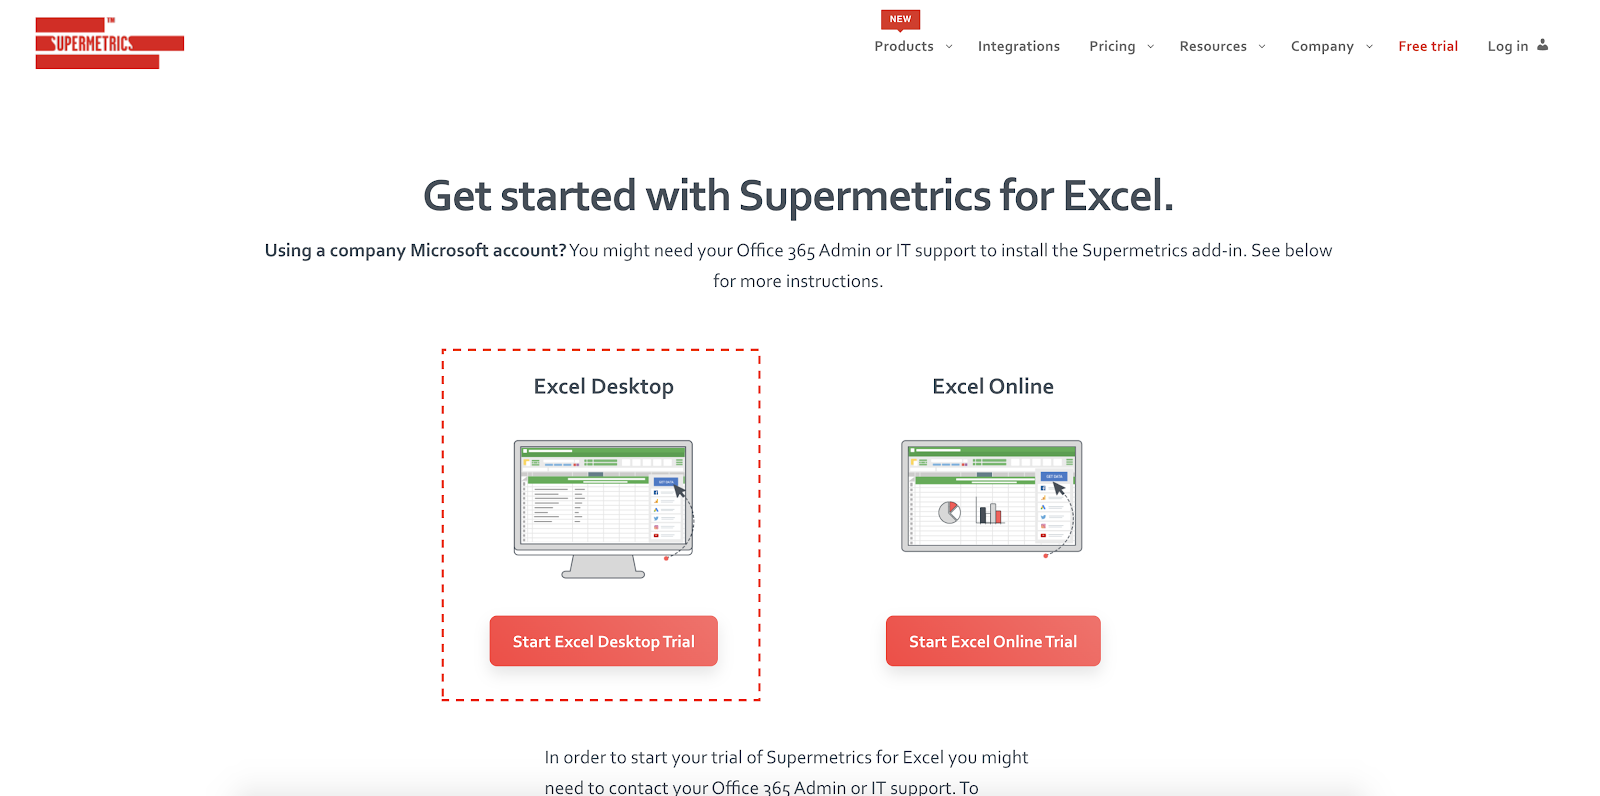
2 – Select the online or desktop version depending on how you use Excel. Given that typically this version is used for large data sets, let’s go with the desktop version.
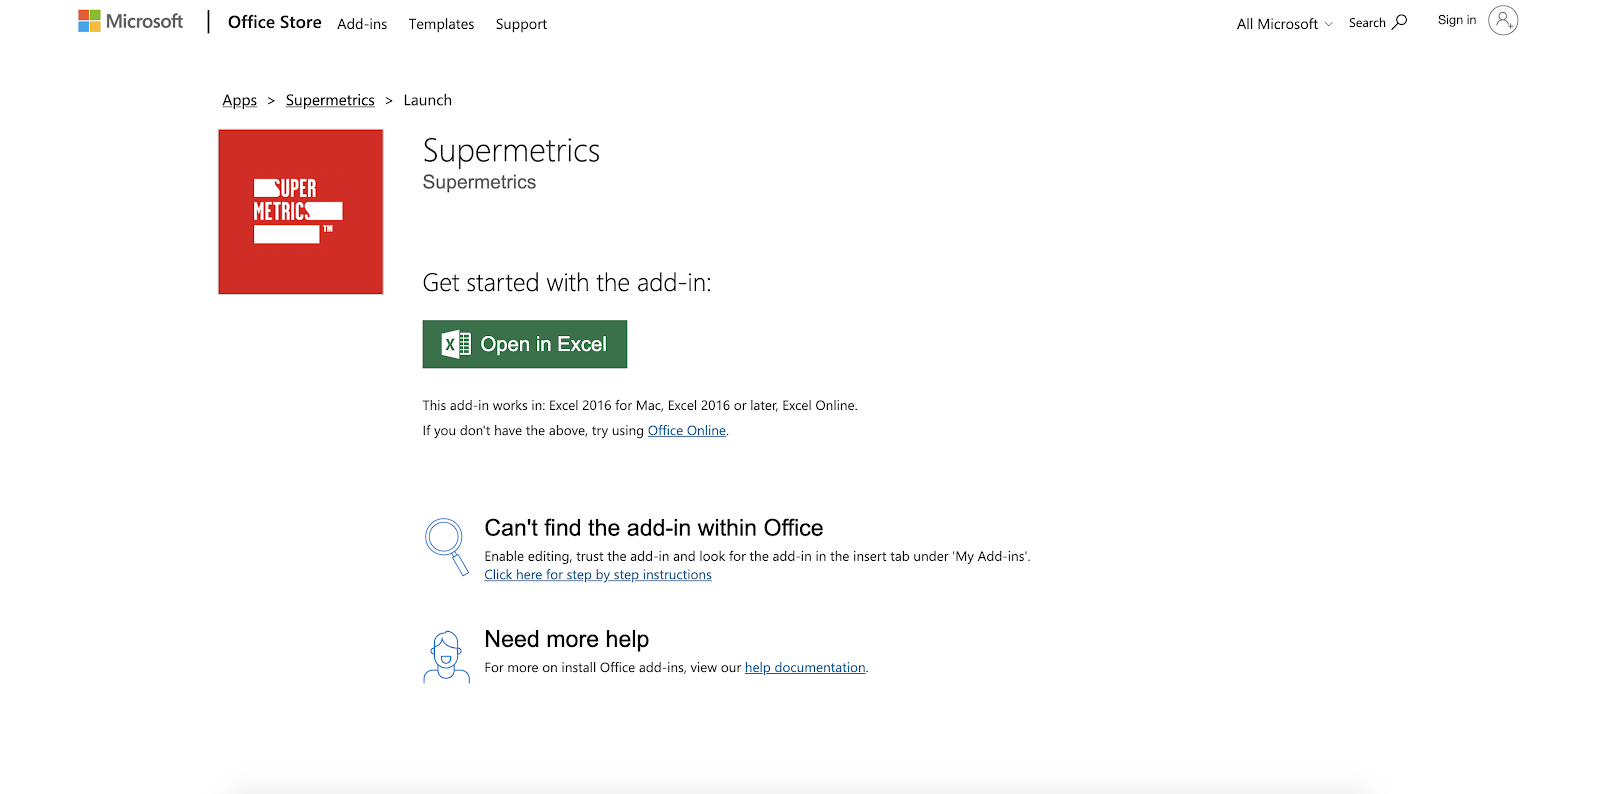
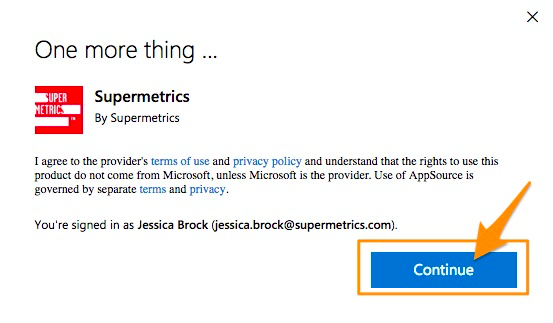
3 – Once you click Start Excel Desktop Trial, click Open in Excel on the next page
4 – This should open Excel. Then you just need to enable editing and give Excel permission to trust the add-on.
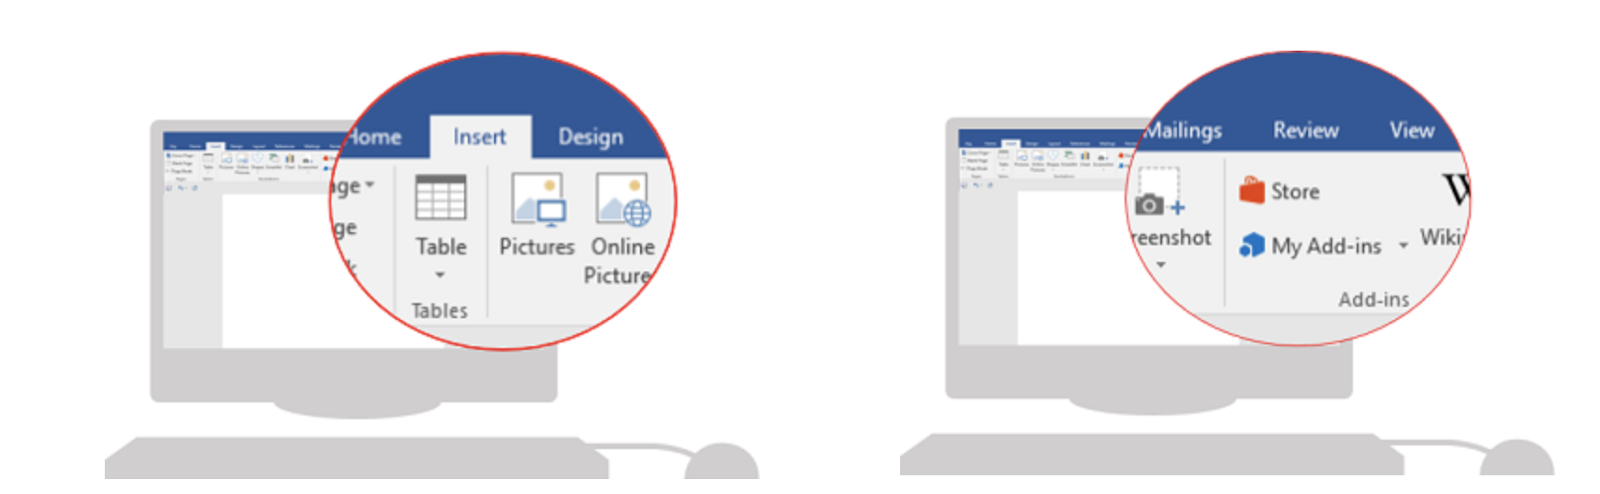
5 – You can access the add-on in the insert tab under ‘My Add-ons’.
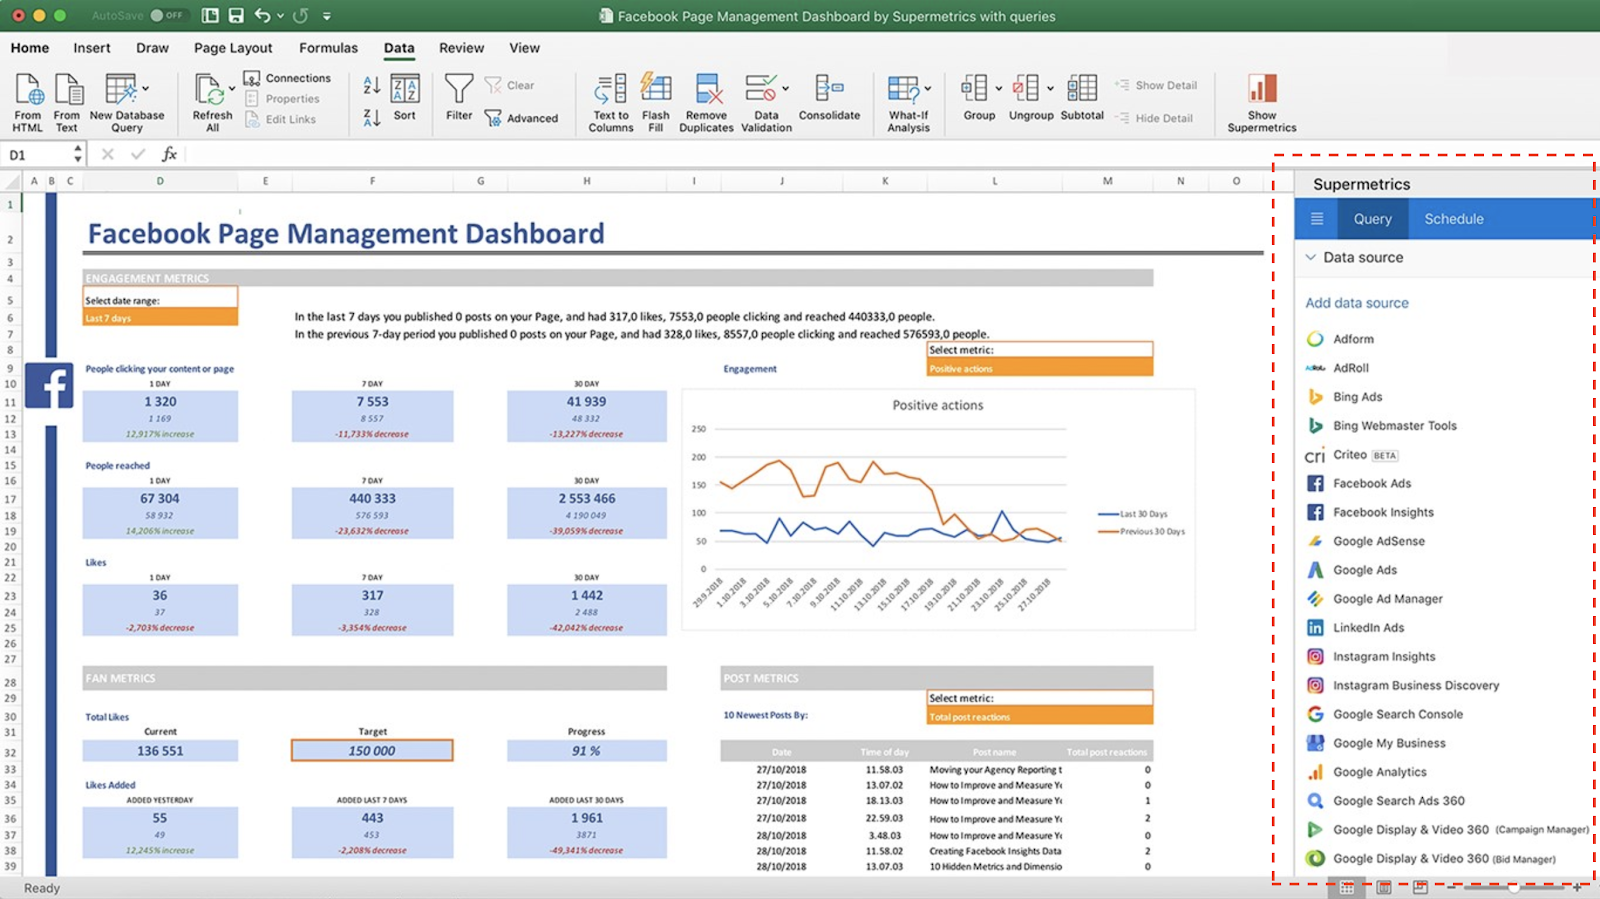
6 – You will now be able to access all features in the side panel similar to the Google Sheets side panel.
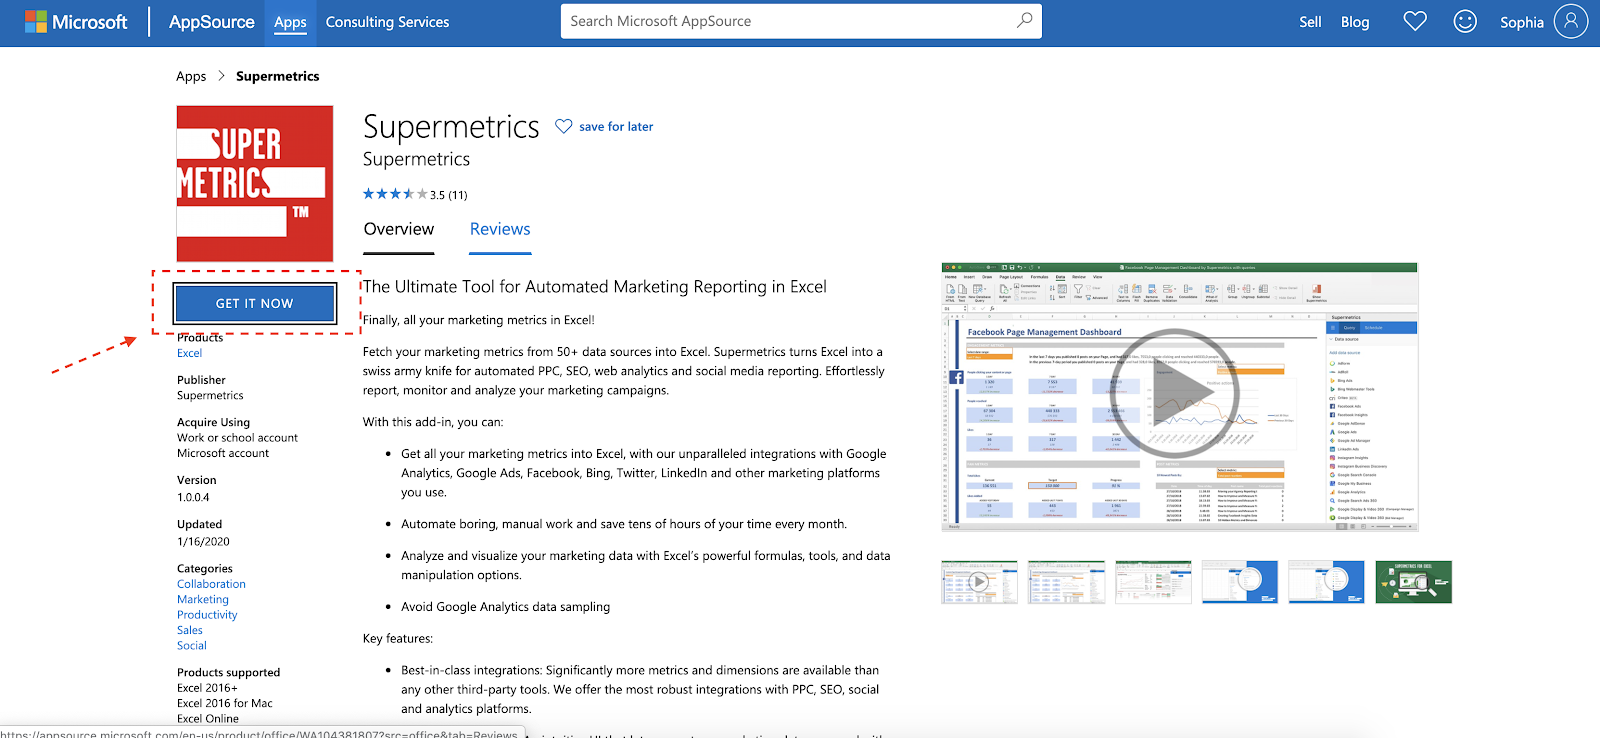
Note: Alternately, you can go to the app in Microsoft App Source and click Get it Now
Automatic Uploader
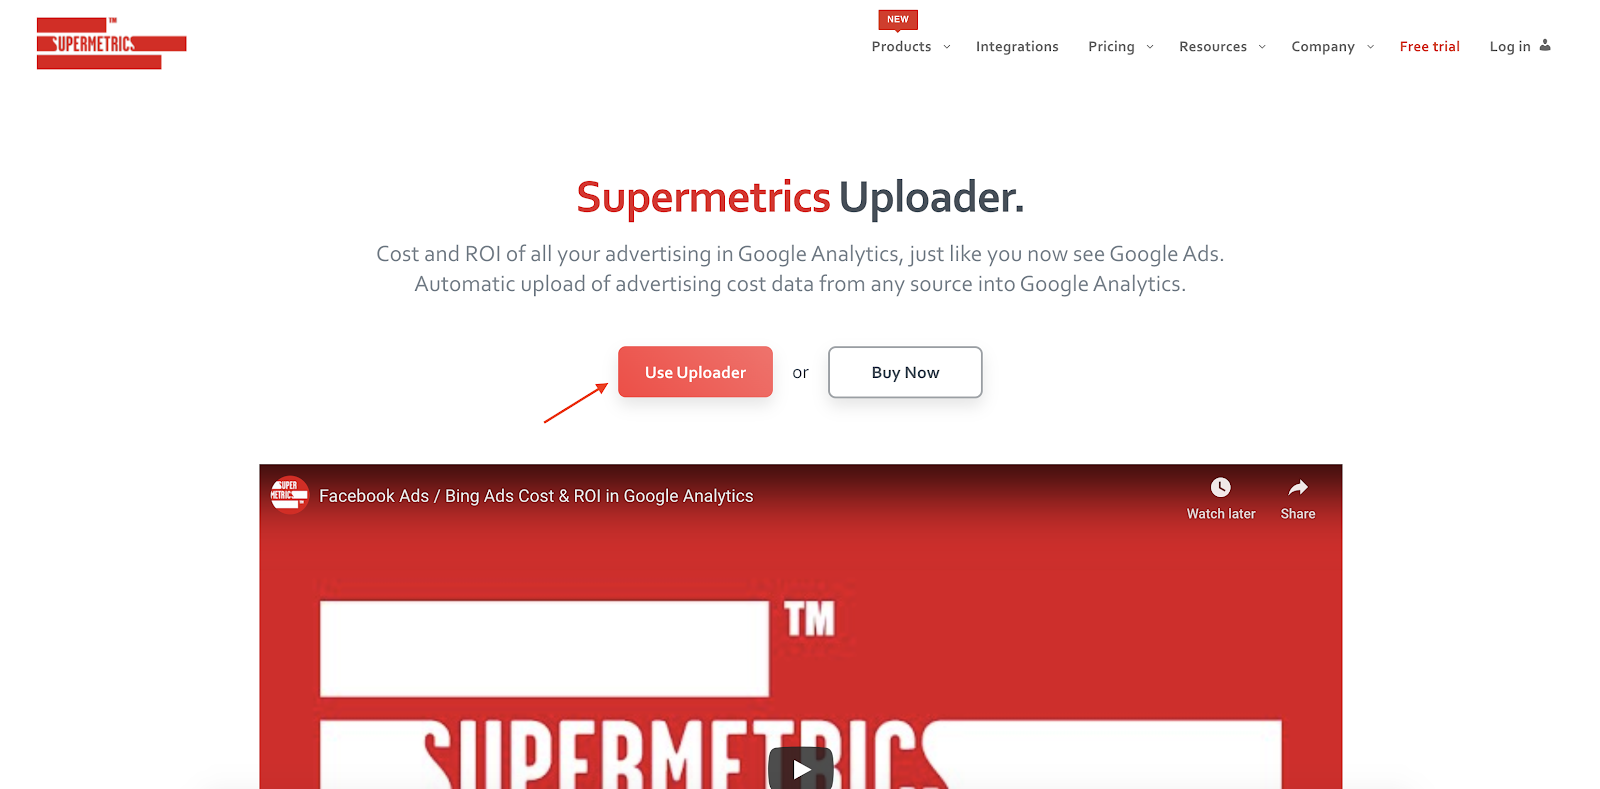
If you want to push cost data to Google Analytics you can use the tool’s automated uploader which automates the process. Importing cost data into Google Analytics allows you to analyze data across channels. The same way you can analyze Google Ads data in GA.
The uploader is similar to what EasyAutoTagging does. However, we push cost data mapped to the UTMs of your Facebook Ads. This way you can analyze cost data on the source, medium, campaign and content level.
Quick setup guide:
1 – Go to https://supermetrics.com/product/supermetrics-uploader and click on Use Uploader
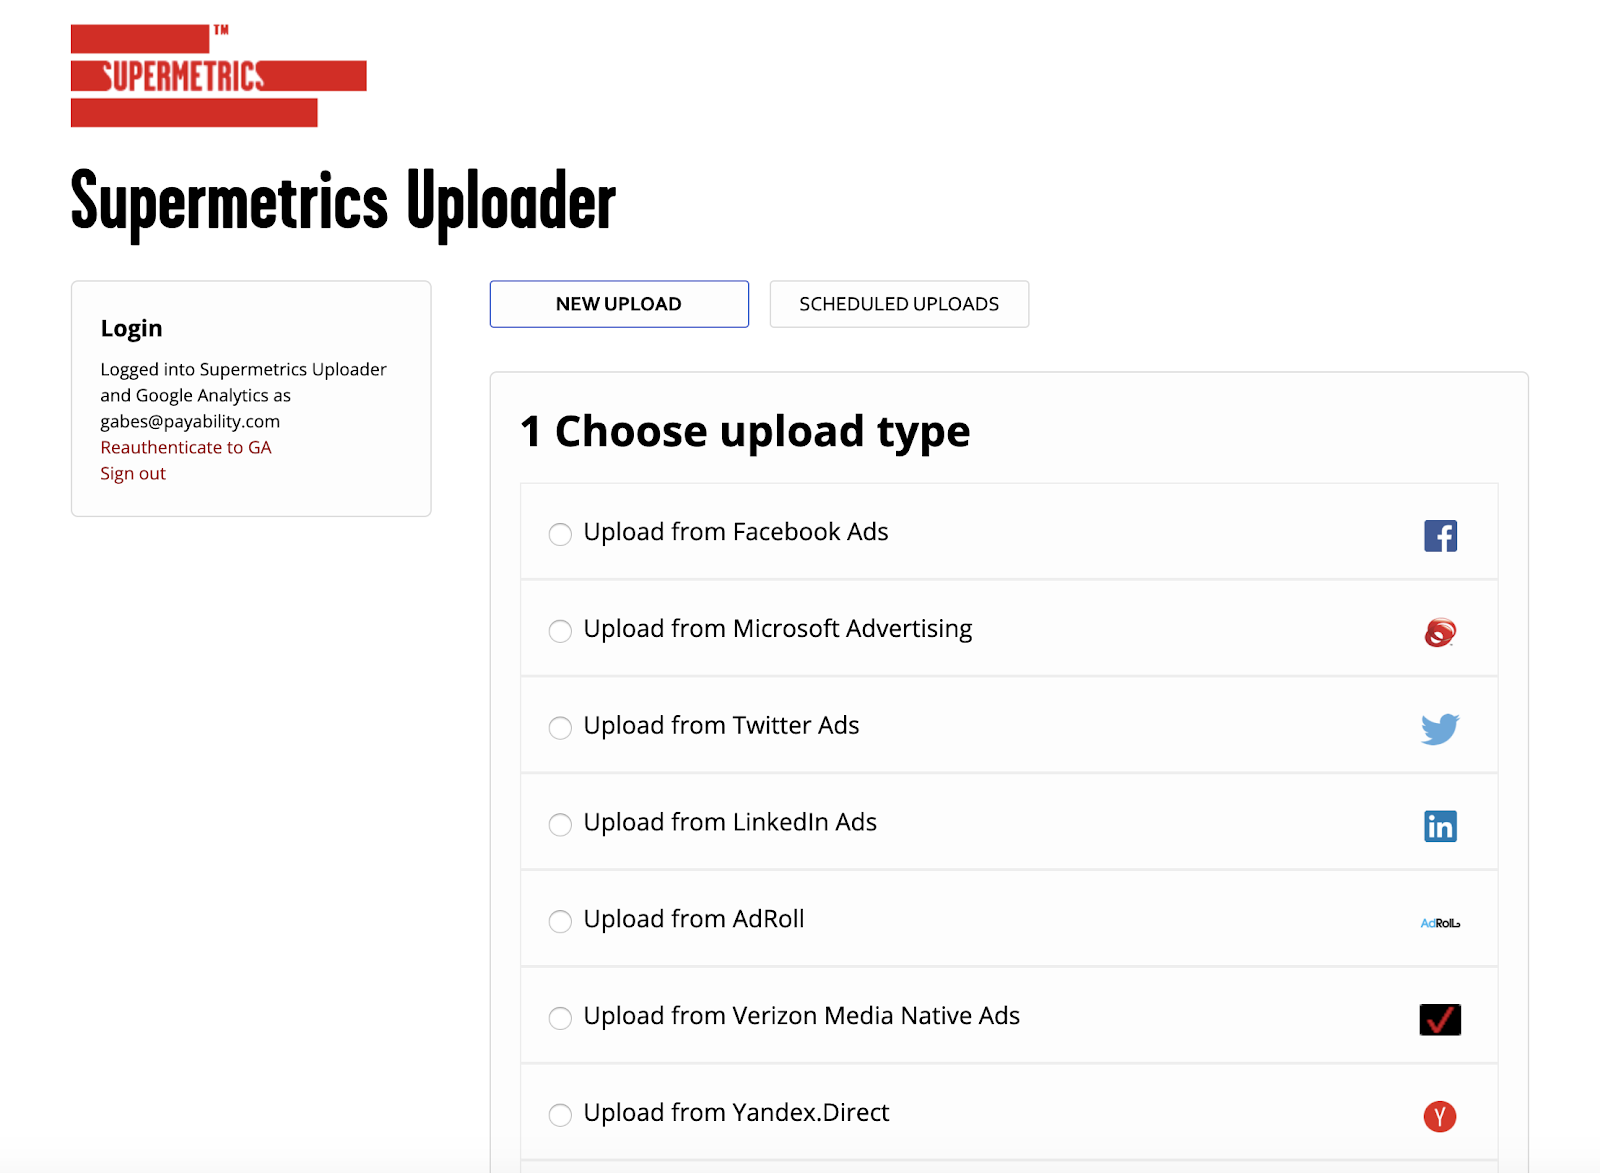
2 – Sign into your Google account that is associated with Google Analytics

3 – Next choose your upload type
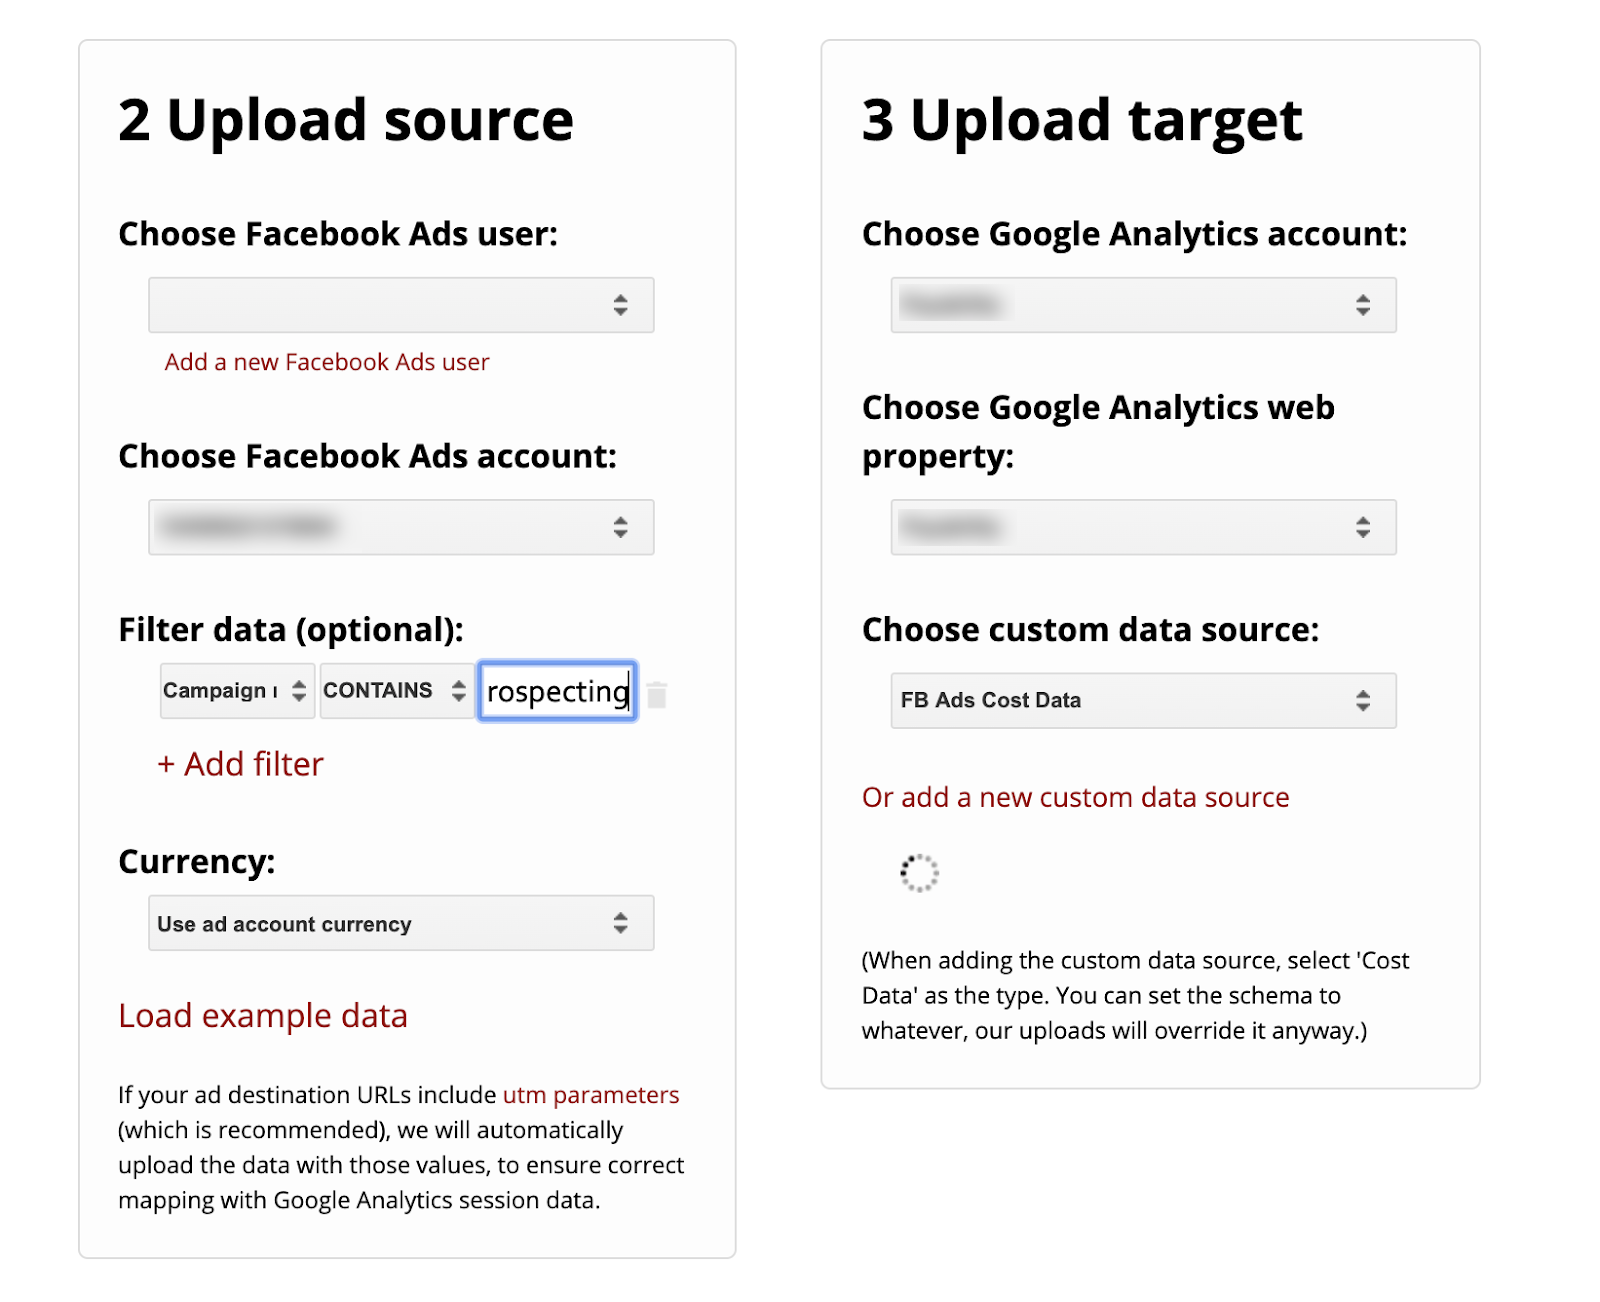
4 – Connect your Facebook account then you can choose to filter down to specific campaigns and define your Currency under Upload Source. You will also need to select a data source under Upload Target. If you don’t have a data source created you can learn how to create one here.
Note: Their pricing is based on your scheduled frequency going from 5 – 200 times per day. However, unless you are running large campaigns and need close to real-time data, 5 daily refresh schedules are plenty.
Conclusion
Reporting is not straightforward. Campaigns move quickly as does everything in the digital landscape.
As a result, it’s critical to have a tool that can adapt to different workflows.
This is especially the case across a fragmented MarTech landscape.
In conclusion, this tool does an amazing job. Particularly, when it comes to removing many pain points that come with pulling data.
It makes it easier for both quick and dirty ad hoc analysis, along with visual reporting.
What tools do you use to make reporting easier? Let us know in the comments.
AUTHOR BIO:

With over a decade of digital marketing experience, Gabe excels in search, display, and social advertising across various industries. He specializes in performance media and data-driven storytelling, building custom digital ecosystems that enhance user experiences across both paid and owned channels. Connect with Gabe on LinkedIn or explore more of his articles here.
Supermetrics is a reporting automation tool that helps digital marketers pull all their PPC, SEO, social and web analytics data into one place including spreadsheets and data visualization platforms for reporting and analysis. Supermetrics is used by +4 marketers across the globe and is the #1 reporting automation tool for PPC, SEO, social and web analytics. Learn more about Supermetrics