Google Data Studio Facebook Reporting [The Complete Guide]
Written by: Gabriel Solberg Read time 13 minutes
How does Google Data Studio Facebook Ads Reporting work? Don’t expect a straightforward answer. Data Studio is part of the Google product stack and Facebook isn’t. So naturally, there won’t be a built-in integration.

However, with a combination of free and low-cost tools. You can set up a semi-automated process for a seamless reporting experience. The idea is to focus on analysis and execution rather than manually pulling Facebook Data into Google Data Studio. No?
There are some excellent reporting tools available on the market, but they all come at a steep cost.
Visualizing your Facebook data efficiently does not always have to break the bank. Let’s start with the basics.
Note: This post focuses on creating a Google Data Studio Facebook Report. However, the same method can be applied to any third party advertising platform.
A Quick Look Back on Google Data Studio
Google Data Studio is a powerful and free reporting platform that Google released to all users on June 2, 2016.
It allows you to connect multiple data sources and can define custom dimensions, metrics, and calculations.
This flexibility combined with the ability to add google sheets as a data source removes the barrier of integrating non-Google products. This makes it possible to build a Google Data Studio Facebook Ads Template.
What This Google Data Studio Facebook Reporting Guide Covers
In this post break down each step so to creating a Facebook Data Studio report. I will use two campaign types as examples. A video awareness campaign and a direct response conversion campaign. To do this requires the following tools:
- Google Analytics
- Supermetrics
- EasyAutoTagging
- Google Sheets
Note: This post explores automating data dumps into Google Sheets. Then connecting Google Sheets as a Data Source. However, with the integration of community connectors, this might not be necessary.
However, this approach can come in handy if:
- You cannot access specific metrics or get the breakdown granularity via the Facebook community connector.
- There is no available community connector for the third party advertising platform you are reporting on.
- You don’t want to pay for a community connector.
Pulling and Aggregating Facebook Data
First, we need to aggregate all Facebook campaign data. Since we want to push this data to Google Data Studio using a Google Sheet data source. To set up the data source we will create a scheduled data call in Google Sheets using Supermetrics. One for our video campaigns and another for our direct response campaigns.
You don’t need to worry about making this pretty. Instead, we will treat data dumps like a database. Google Sheets will house all our Facebook campaign data and automatically update once a day.
Preparing Facebook Data for Data Studio
Let’s get started:
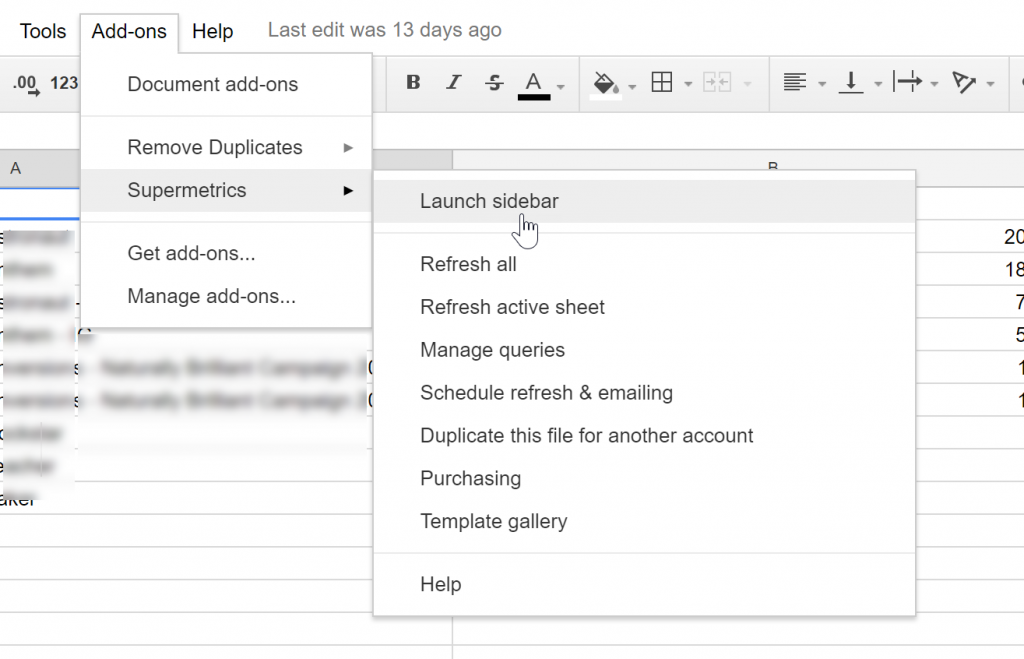
Open a blank Google Sheet. Then open the Supermetrics Sidebar.
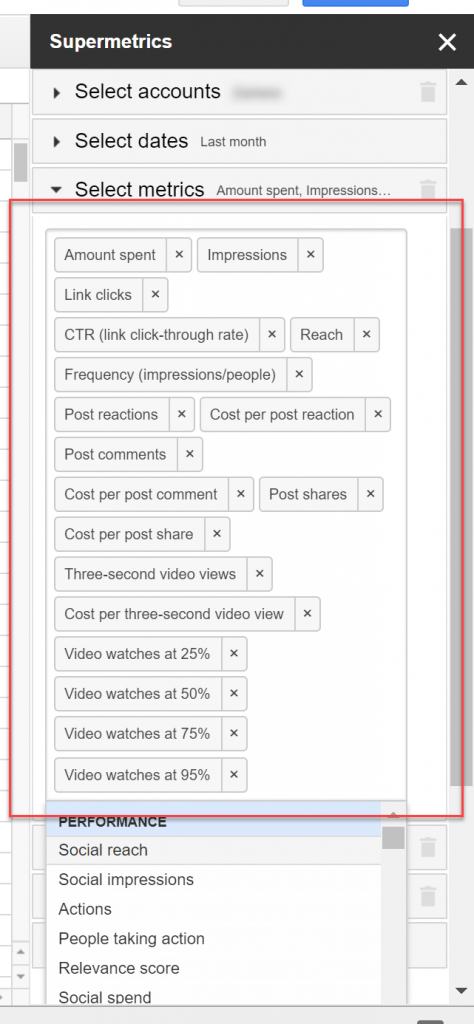
Next, I will want to pull all relevant Facebook Campaign data.
Here are the metrics I would include for Video Campaigns:
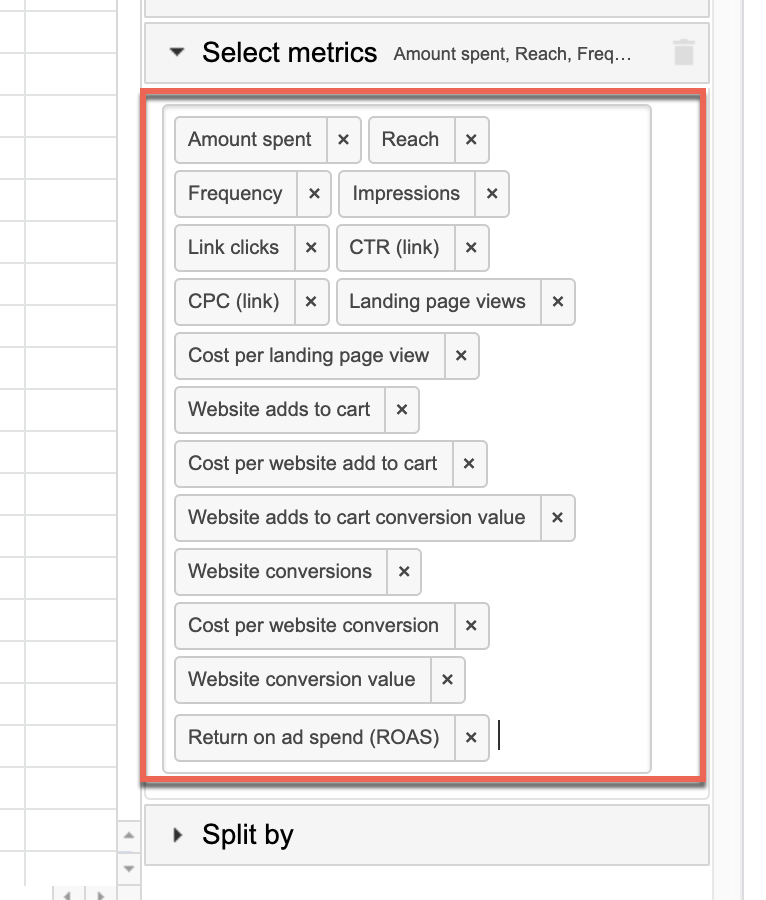
And here are the Facebook metrics I would include for Direct Response Campaigns:
Next, we will break this data into two separate tabs.
- The first tab will split the Facebook data by campaign giving us aggregate results for each campaign.
- The second tab will split the Facebook data by date so that we can get a daily breakdown. The daily breakdown is helpful for when you want to visualize trend lines over time.
Notes: Make sure to:
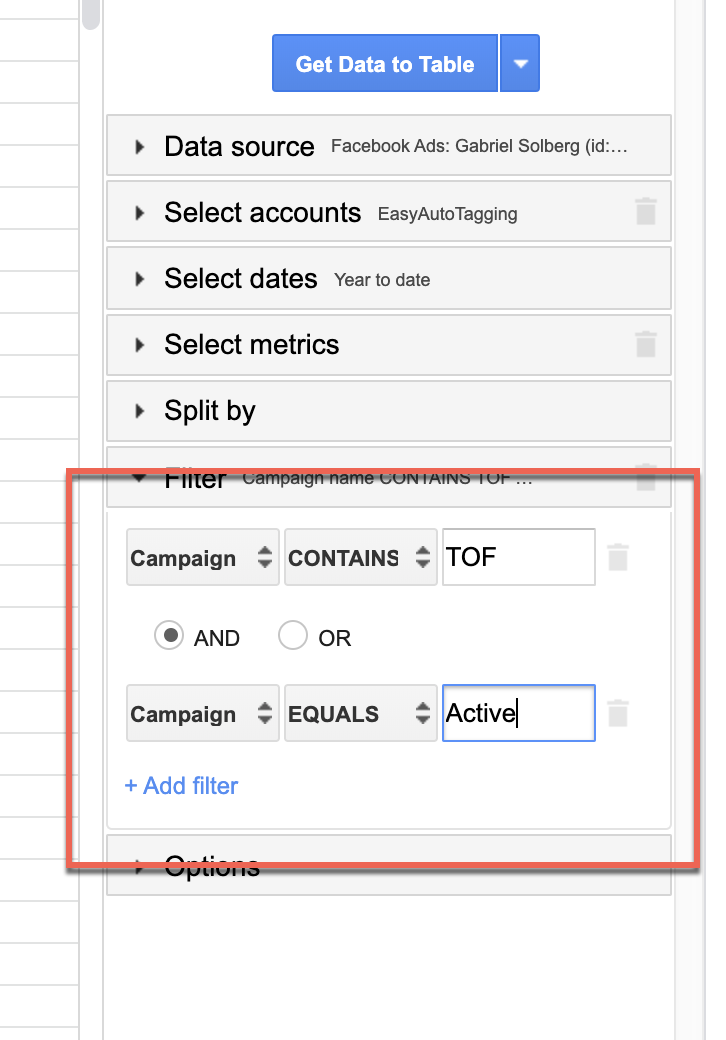
- Set the appropriate campaign filters in the Supermetrics query.
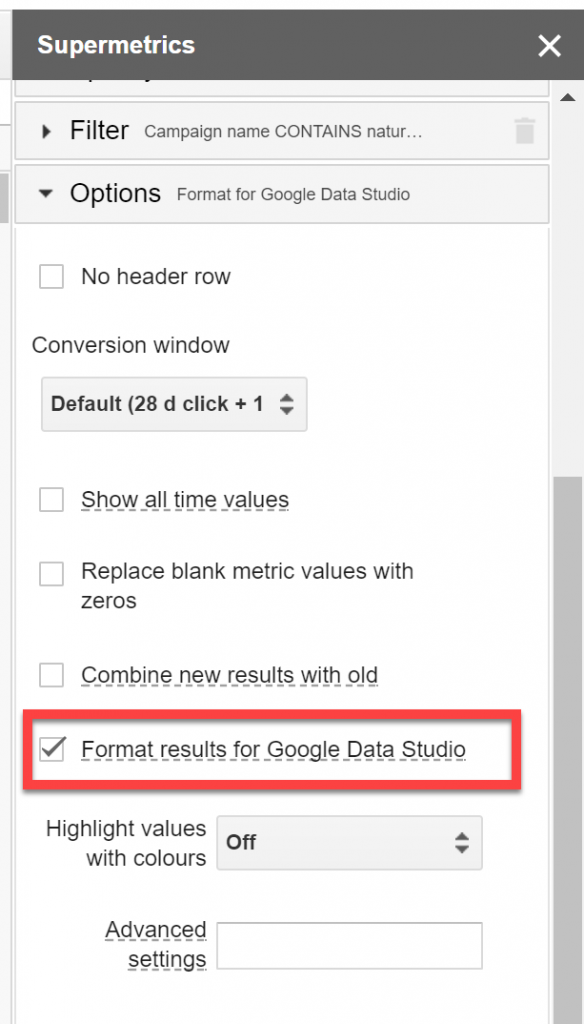
- Ensure that the ‘Format results for Google Data Studio’ is enabled under options in the sidebar.
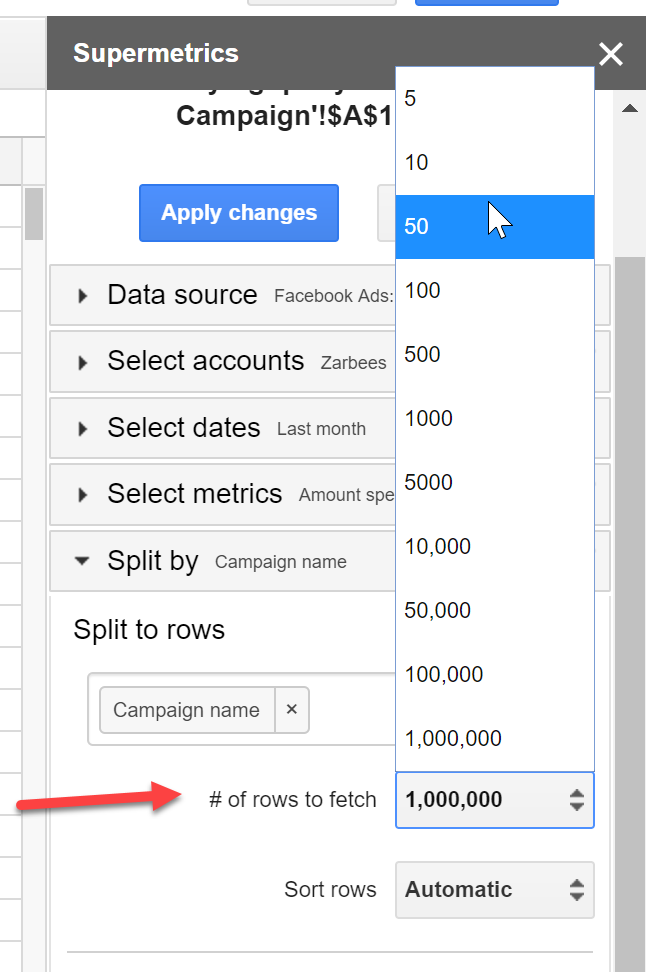
- Set the number of rows higher than five so that your data does not get cut off.
Set Campaign Filters:
Format Results for Google Data Studio:
Define the Number of Rows:
With the query set up completed. Let’s look at the scheduling feature. Supermetrics has the ability to refresh data on a defined schedule.
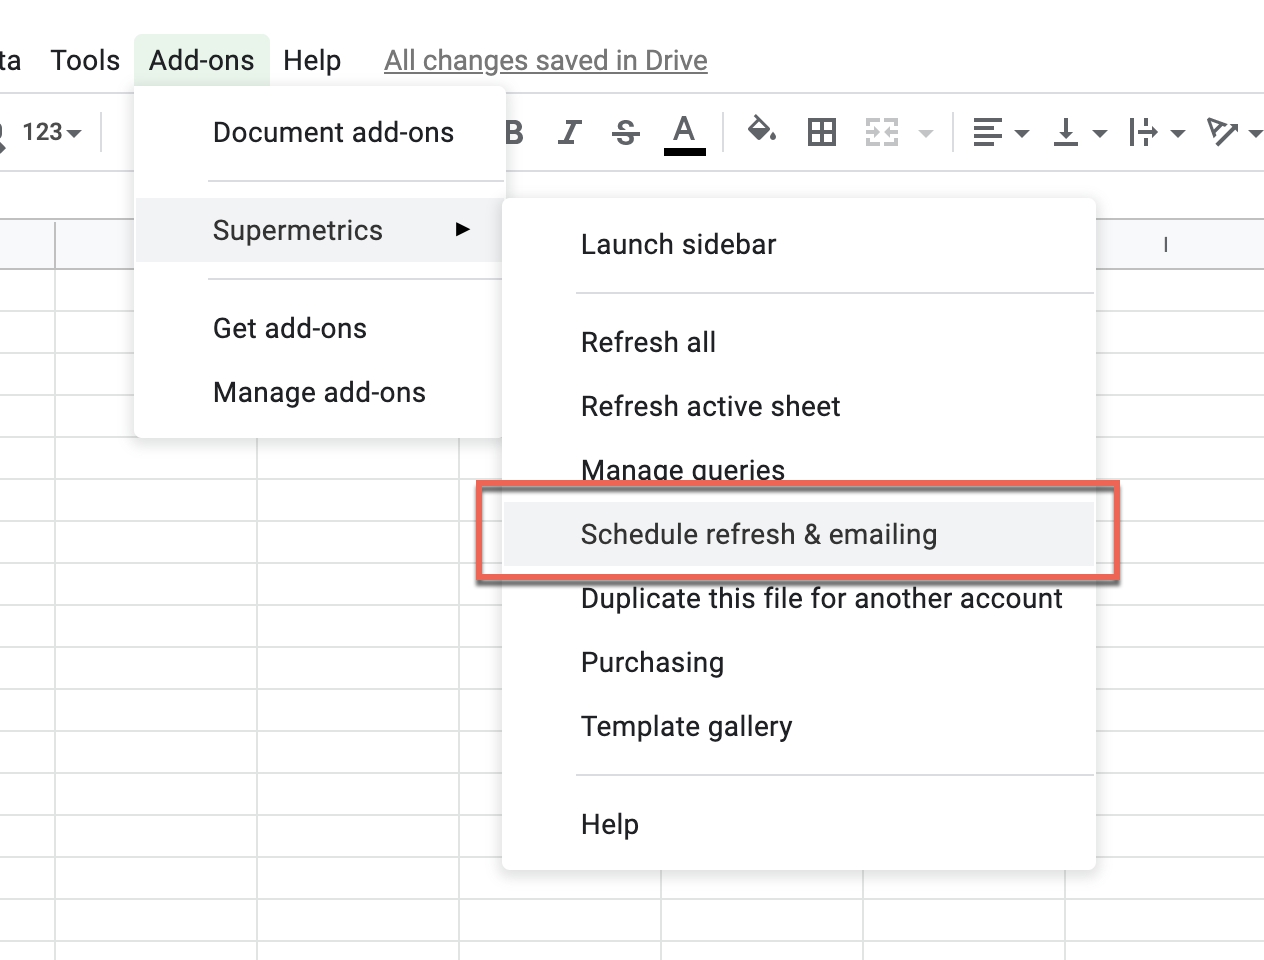
You can access scheduling in Google Sheets under Add-ons > Supermetrics > Scheduling refresh and emailing:
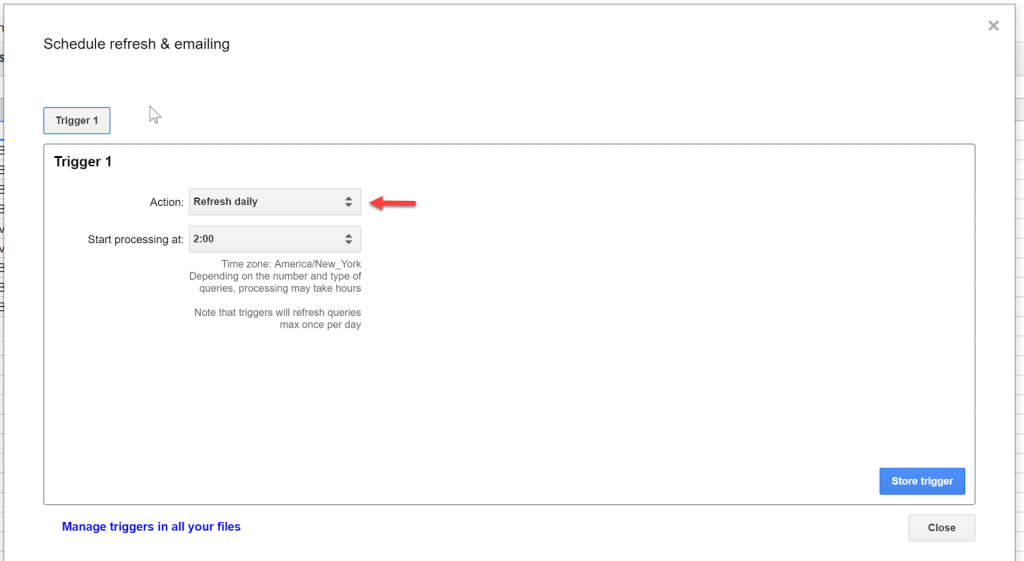
In this case, I will set the frequency to Refresh Daily. This ensures that when I look at my report in Google Data Studio I will always have the most recent data.
Now that we have our Facebook campaign data formatted as a data source. Let’s take a look at connecting them to Data Studio for our Google Data Studio Facebook Reporting.
Connecting Facebook Data Sources in Google Data Studio
Head over to Data Studio, create a new report and call it Facebook Report.
The first thing we need to do is create our Data Sources.

For Facebook Data we will create two Data Sources, One for each tab that in the Google Sheet we created above.
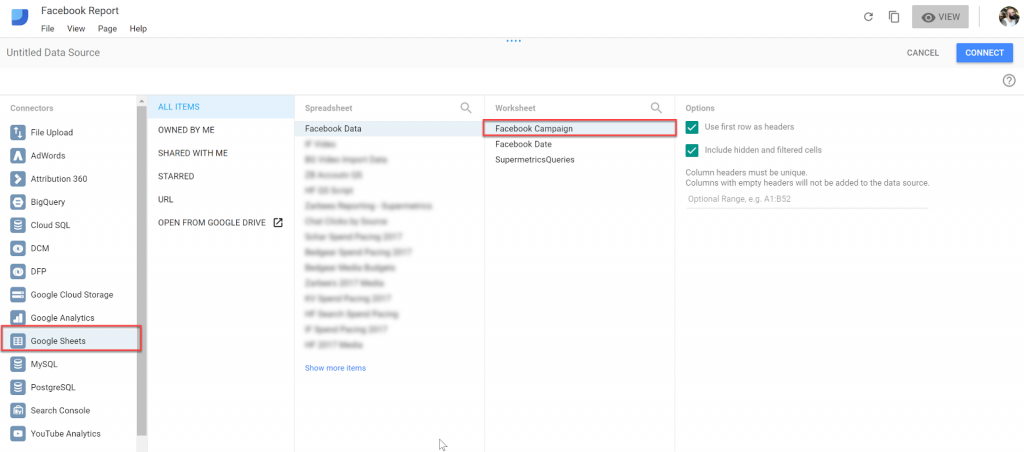
For the first step select Google Sheets as the Connector > Select the Spreadsheet > Select the Campaign Tab and click connect.
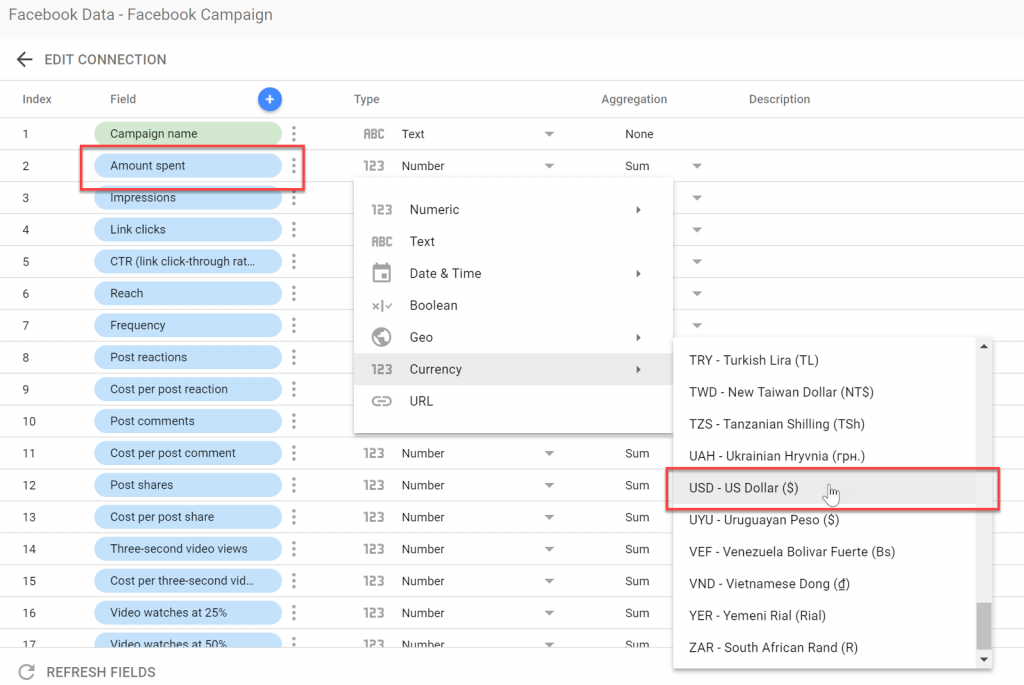
Next, define the data type and aggregation for each metric.
Note: This only needs to be done once for each data source.
So as an example for spend values we will want to set ‘type’ for the field ‘amount’ spent to currency.
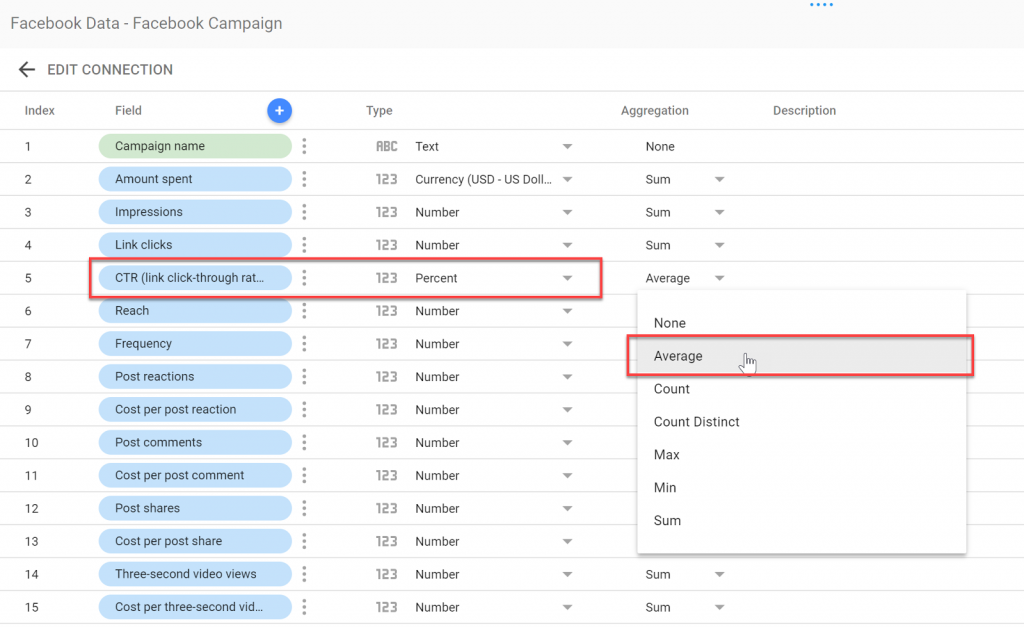
And ‘Type’ for CTR to percent and ‘aggregation’ to average.
Once all field types and aggregations are defined, we need to create calculated fields for the metrics that we were not able to pull using Supermetrics.
In this case, I would also want to see view completion rates and cost for each completion rate.
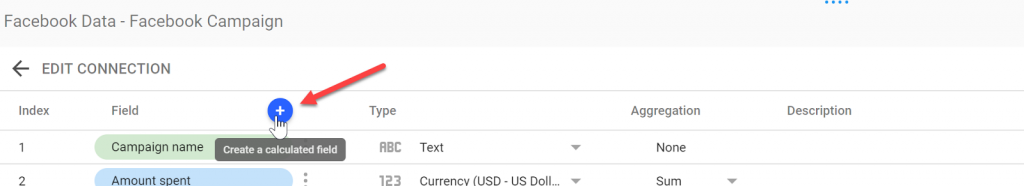
Let’s go ahead and define a calculated field.
Click the + icon at the top of the field column.
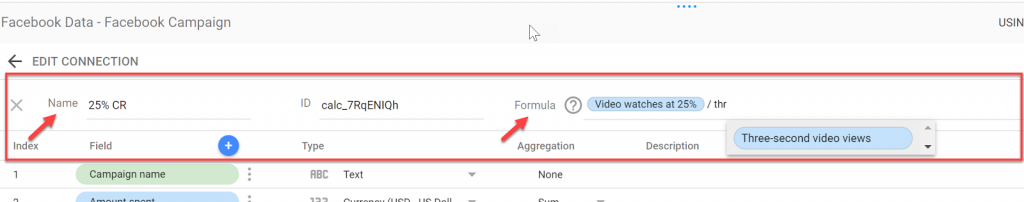
You will have the ability to name and define the calculations for the new calculated field.
In this example, we are creating a custom calculated field for 25% Completion Rates.
Name: 25% CR
Formula: video watches at 25% divided by three-second video views.
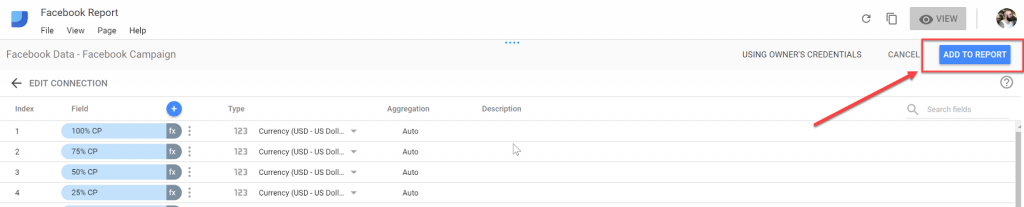
You can do the same for 50%, 75% and 100% completion rates. As well as the cost per each percentage completion rate.
Note: Do not forget to set the field type and aggregation for these newly calculated fields as well.
Once these have been created click add to Report
Go ahead and create a new data source using the same steps as above for the ‘Date’ tab.
Google Analytics for Facebook Data
I need to step back for a second and talk about tracking conversion on Facebook and in Google Analytics.
Google operates on a last-click reporting model. Facebook on a 28-day post-click and 1-day post view reporting model. More about this in a minute.
As a digital marketer, it is important to understand both short and long term performance. As a result, I find it important to use both reporting metrics when analyzing performance.
The question is how do I get my Facebook data into Google Analytics?
Two things need to happen to map Facebook metrics and GA session data in Google Analytics:
Consistent URL parameters – UTM Profiles
Google Analytics Cost data imports – Matching your UTM Profile
The easiest way to do this would be to:
Automate the tagging process using UTM Profiles
Automate cost, impression and click data imports using the same UTM Profile.
This will ensure that sessions and Facebook metrics are ‘joined’ in Google Analytics.
EasyAutoTagging will do this for you.
Alternatively, you can manually tag your ads with UTM Parameters. Then import Facebook campaign data into Google Analytics. As long as you are using the same UTM Profile your data should join in Google Analytics.
You can learn more about both the manual and automated process of importing data here.
To learn more about automated tagging check our this post.
Either approach, automated or manual can work. Once set up you can report on Facebook campaigns in Google Data Studio. Since we can pull Facebook and GA metrics using the Google Analytics data connector.
Real quick, before we get started with adding a Google Analytics data connector. I want to go over Ecommerc conversion reporting on in Google Analytics and on Facebook.
Google Analytics and Facebook Ecommerce Conversions
Google does come with robust e-commerce conversion reporting. Most of these metrics are available in Google Data Studio. Because of this, you don’t have to define custom fields. Only as long as you are importing Facebook cost data into Google Analytics. (
Facebook and Google Analytics attribution reporting varies. As stated above, it is important to analyze both reports for better insights.
Google Analytics will give me last-click conversions coming from Facebook.
So what are some questions to ask?
How are direct response ads performing in the short term?
Are they driving enough sales to maintain a healthy relationship of ad cost to revenue?
Facebook provides results within the conversion window (the default is 28 days post-click).
Some good questions to ask here are:
How are top of funnel ads performing over a 7, 14 or 28-day window?
Are people checking out the site from an ad but coming back later to complete the purchase?
Note: This is a bit of a sidebar. Make sure to exclude existing customers and understand repeat purchase behavior. Take a CPG product. If most people purchase for a second time after 15 – 20 days looking at a 28-day window does not make all that much sense. However, if selling large ticket items then you want to expand to 28 days assuming there is a longer consideration phase.
Earlier in the post, we prepared data for Google Data Studio. We pulled Facebook metrics for both Awareness and Direct response campaigns. We will use these in our Google Data Studio Facebook report. Understanding that they reflect Facebook’s attribution measurement.
To understand last click performance we will be adding Google Analytics as a data source.
Adding Google Analytics as a Data Source To Google Data Studio
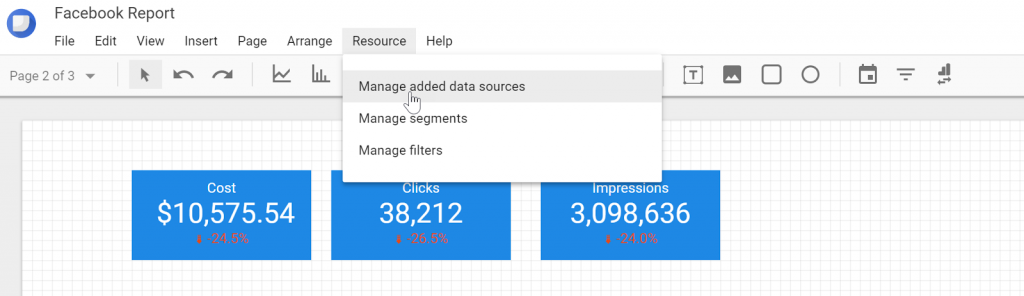
Go to resources > manage added data sources
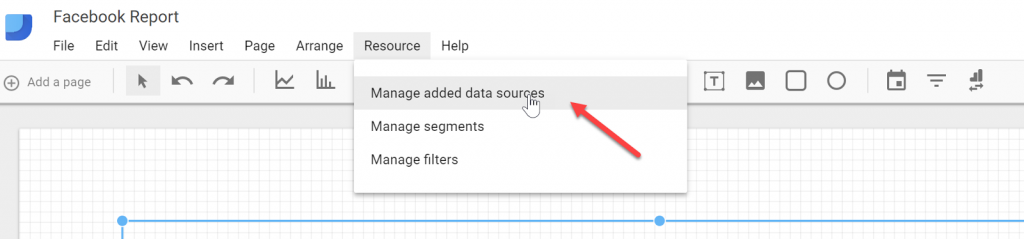
Select Google Analytics as the connector, choose your desired property and view then click connect.
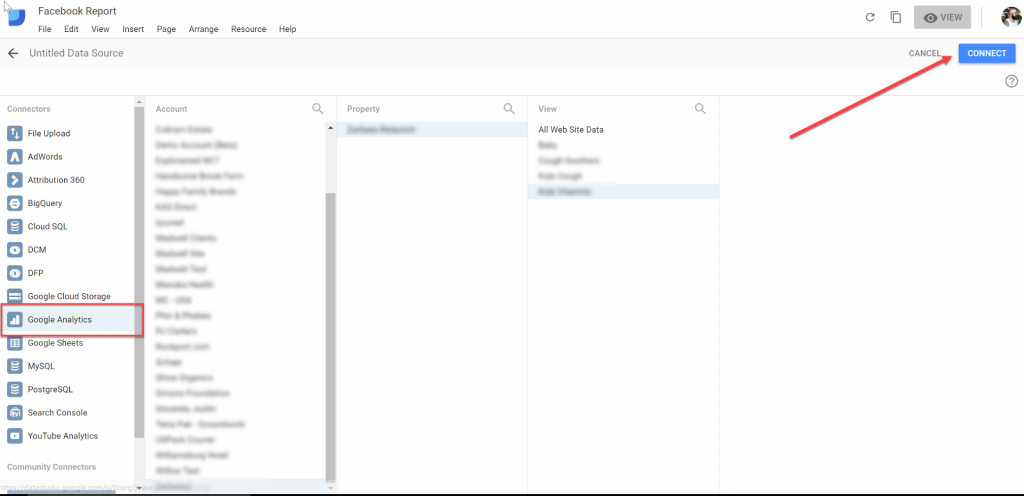
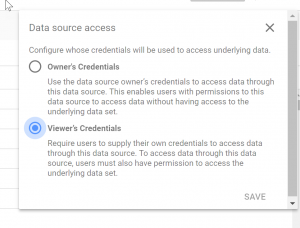
Configure user selection. If the report will be shared or worked on internally by multiple users who have access to the data sources then selecting ‘viewer’s credentials’ would be the proper fit.
Otherwise, select ‘owner’s credentials’.
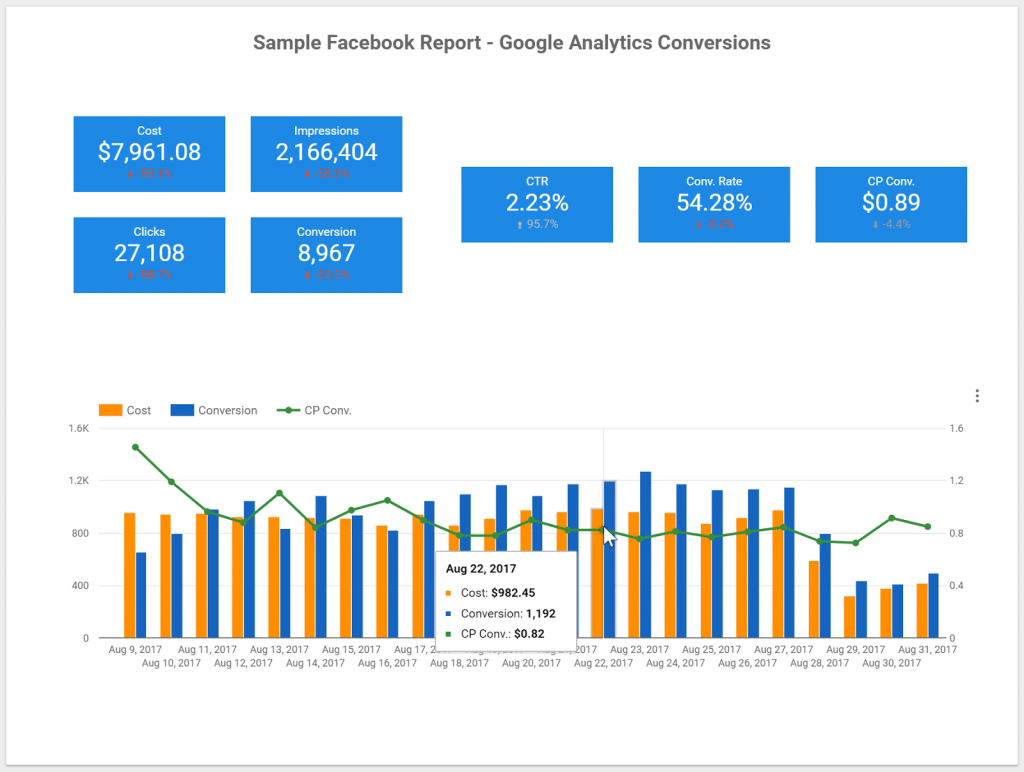
Now we want to create calculated fields. We will also want to define field types and aggregations for conversions, cost per conversions and conversion rates.
Google Analytics Goals, Conversion, and Facebook Conversions
Knowing that Facebook and Google Analytics conversion attributions vary. Results will always look different between the two platforms.
For holistic insights into campaign performance, you must analyze both conversion trends.
To complete our Google Data Studio Facebook Report we will look at setting this up. This will be achieved with Google Analytics Goal Conversions and respective Facebook metrics.
For this example, we will go over three different conversion buckets. Also looking at how these integrate into reporting.
Google Analytics Goal Conversions (KPI)
Google Analytics E-commerce Conversion
Facebook Ecommerce Conversions
Site Visitor and CPV
First off, we will want to set up a custom field for visitors (sessions) and a calculated metrics field for cost per visitors (CPV).
The reason is to account for any advertising platform clicks to session discrepancy. I have seen a click to session drop off of up to ~25%.
Hence it is vital to measure traffic efficiency and performance rates respective to actual site visitors. As opposed to just clicks.
Go to resources > manage added data sources
Click the + icon at the top of the field column and define the custom field values as follows:
Name = visitors
Formula = sessions*1
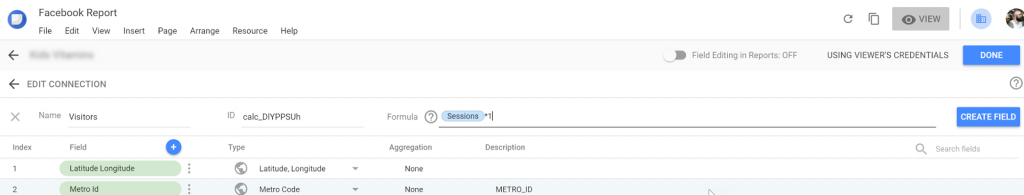
Tip: This works for overwriting existing labels. A hack if you want to rename any of your field labels.
Update: This hack is not required anymore since you can now rename default dimensions.
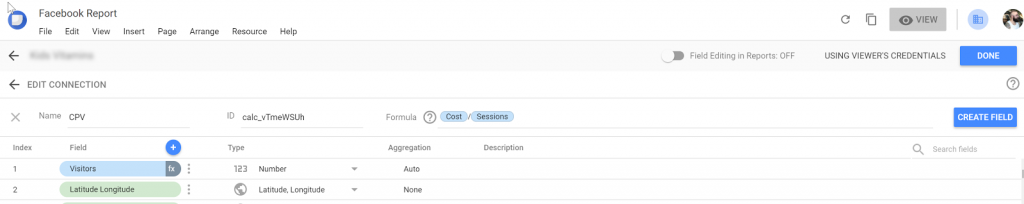
Click the + icon again at the top of the field column and define the custom field values as follows:
Name = CPV
Formula = cost / sessions
Now that we have these set up let’s move on to Google Analytics Goal Conversions
Google Analytics Goal Conversions (KPI)
KPIs are helpful when measuring micro-conversions. For example, user engagement or more specific non-transactional conversions such as lead generation.
For this example, to measure key engagements, we will use multiple engagement goals. This will create a single conversion aggregating actions into one conversion goal. (If we were tracking leads we would use that specific goal and rename the default dimension).
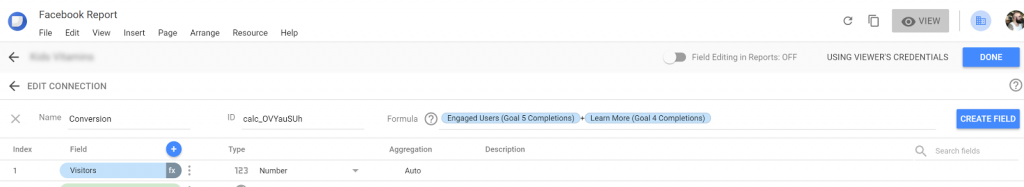
Conversion Field
Click the + icon at the top of the field column and define the custom field values as follows:
Name = conversion
Formula = engaged user (goal 5) + learn more (goal 4)
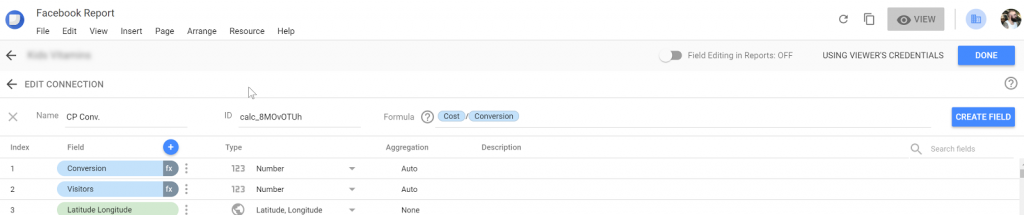
Click the + icon again at the top of the field column and define the custom field values as follows:
Cost Per Conversion Field
Name – CP Conv.
Formula – cost divided by conversion
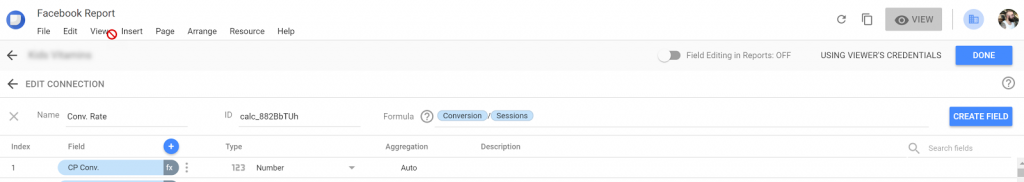
Conversion Rate Field
Click the + icon again at the top of the field column and define the custom field values as follows:
Name – conv. rate
Formula – conversion divided by sessions
Note: Do not forget to set the field type and aggregation for these calculated fields.
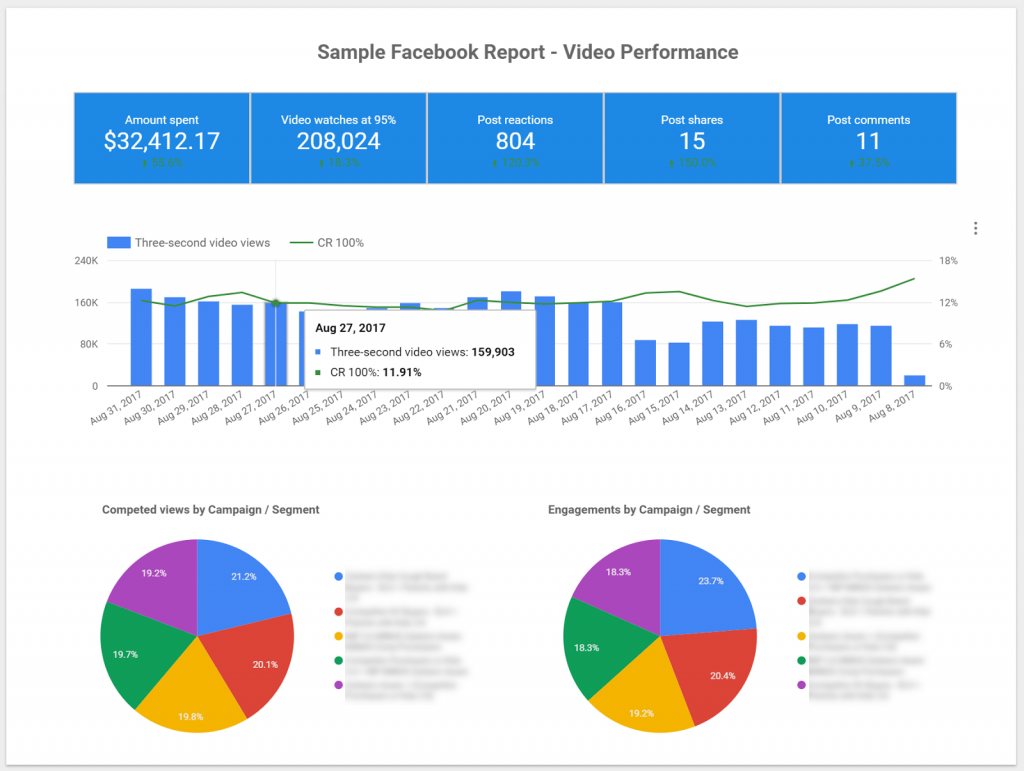
Visualizing The Data
Now you can create easy to read and visually pleasing Google Data Studio Facebook reports. In addition, these dashboards will update dynamically (as long as you set rolling dates).
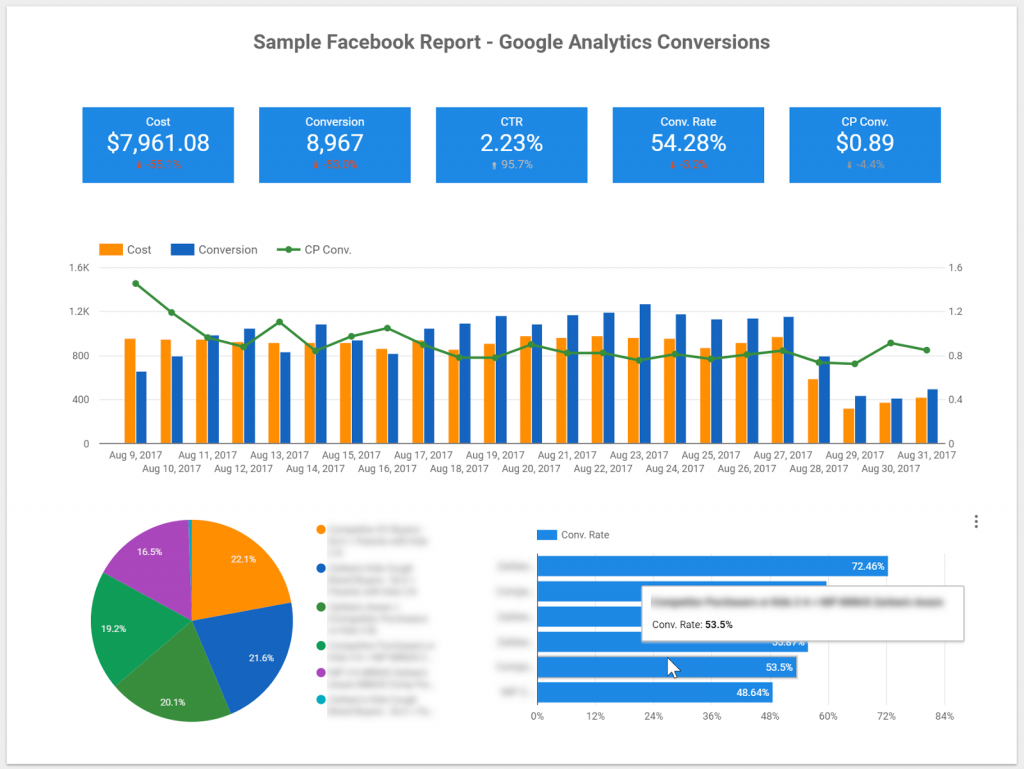
Looking at video campaign performance:
As well as direct response conversion performance:
Or conversion performance that includes graph segmented by audience:
Conclusion
Reporting can be extremely counterproductive and inefficient. But with a little creativity and leveraging free and low-cost tools, you can create a seamless reporting experience. Having a system in place for Google Data Studio Facebook Reporting will enable you to focus on the more important tasks.
What works for you? How have you created an effective and efficient Google Data Studio Facebook Ads Template? Let us know in the comments.
AUTHOR BIO:

With over a decade of digital marketing experience, Gabriel excels in search, display, and social advertising across various industries. He specializes in performance media and data-driven storytelling, building custom digital ecosystems that enhance user experiences across both paid and owned channels. Connect with Gabriel on LinkedIn or explore more of his articles here.
I discovered your blog site on google and check a few of your early posts. Continue to keep up the very good operate. Seeking forward to reading more from you later on!?
Thanks
I truly appreciate this article post. Much obliged.
I really liked your article post.Much thanks again. Really Great.